
MONEYJOURNEY RESEARCH
UnitedHealth Group Inc (UNH)
QUALITY VALUE INVESTING RESEARCH
| SECTOR Healthcare — Healthcare Plans |
PRICE AT ANALYSIS $401.43 |
MARKET CAP $360.32B |
DATE October 18, 2026 |
| FAIR VALUE $505.96 |
MARGIN OF SAFETY 20.7% |
QUALITY SCORE 75.0 / 100 |
SIGNAL Buy |
| TL;DR — EXECUTIVE SUMMARY Verdict — Buy — shares trade at $401.43 against a probability-weighted fair value of $505.96, a margin of safety of 20.7% and an expected annual return of 13.6%. Business quality — UnitedHealth is a premier healthcare compounder (75.0/100 Quality Score) delivering an efficient 12.4% ROIC through its integrated health insurance andOptum care service platforms. Key risk — Medicare Advantage rate cuts present the main risk; long-term investors should accumulate given the 20.7% margin of safety and clear Buy signal. |
01 — MoneyJourney Introduction
This report follows the MoneyJourney quality value investing framework: understand the business first, assess its quality and durability, calculate a reasoned estimate of intrinsic value, and only act with a margin of safety. The goal is a repeatable, transparent process — not a prediction.
UnitedHealth Group presents a high-quality entry point for value investors following temporary sentiment headwinds that have priced the stock at an attractive discount to intrinsic value. Its essential role in healthcare infrastructure and resilient cash flow generation offer strong defensive characteristics across all market cycles.
02 — The Business
What They Do & How They Make Money
UnitedHealth Group Inc. is the largest diversified healthcare enterprise in the United States, managing health coverage and care delivery for over 50 million individuals worldwide. The business operates through two primary divisions: UnitedHealthcare and Optum. UnitedHealthcare provides comprehensive health benefits across individual, employer-sponsored, Medicare Advantage, and Medicaid markets, deriving revenue from insured premiums and administrative fees. Optum provides health services, data analytics, and pharmacy benefits, operating through three distinct sub-segments: OptumHealth, OptumInsight, and OptumRx. OptumHealth delivers care directly through physician networks, OptumInsight offers health technology and software to healthcare systems, and OptumRx operates a major pharmacy benefit management network. The customer base spans individual consumers, commercial employers, state and federal government entities, hospital systems, and life sciences companies. Operations are overwhelmingly concentrated within the United States, with a small international presence in Latin America and Europe. Together, UnitedHealthcare and Optum form a closed-loop system where insurance clinical data informs patient care services, maximizing operational efficiency across the enterprise.
Competitive Landscape
UnitedHealth Group competes directly with major managed care organizations including Elevance Health, CVS Health (Aetna), The Cigna Group, and Humana. Relative to Elevance Health and Humana, UnitedHealth possesses superior operational scale and a far more extensive healthcare delivery footprint through Optum, granting it unmatched negotiating power with providers. Against CVS Health and Cigna, OptumRx maintains a leading pharmacy benefit management market share while benefiting from deep integration with primary care practices. Although elevated medical utilization rates pose an industry-wide challenge, UnitedHealth’s overall market leadership remains firmly entrenched and continues to strengthen relative to single-line competitors.
PEER COMPARISON
| COMPANY | OPERATING MARGIN | ROIC |
| UnitedHealth Group Inc (UNH) | 5.3% | 12.4% |
| Elevance Health Inc (ELV) | 4.5% | 10.5% |
| CVS Health Corp (CVS) | 4.0% | 6.5% |
| The Cigna Group (CI) | 4.8% | 8.0% |
| Humana Inc (HUM) | 2.5% | 6.0% |
Revenue Breakdown
BY SEGMENT
UnitedHealthcare generates approximately 55% to 60% of total revenue, while Optum contributes roughly 40% to 45% prior to intersegment eliminations.
BY GEOGRAPHY
The United States accounts for approximately 95% of consolidated revenues, with international operations generating the remaining roughly 5%.
Competitive Advantages & Moat
- Brand Strength — Limited
- Network Effects — An expansive network of participating healthcare providers, hospitals, and clinics creates self-reinforcing network effects that attract both corporate employers and individual members.
- Switching Costs — High switching costs exist for corporate clients integrated into UnitedHealthcare’s administrative infrastructure and health systems using Optum’s embedded software platforms.
- Cost Advantages / Scale — Unrivaled operational scale across insurance and pharmacy services enables UnitedHealth to secure superior clinical pricing and minimize unit administrative costs.
- Regulatory / IP Protection — Limited
Risk Factors
- Regulatory reductions in Medicare Advantage funding or restrictive federal policy changes could significantly compress operating margins across both UnitedHealthcare and Optum.
- Sustained increases in medical utilization rates among senior populations could elevate medical loss ratios beyond pricing adjustments.
- Antitrust enforcement or legislative restriction on vertical integration between health insurers and pharmacy benefit managers could limit Optum’s growth strategy.
Bull Case
UnitedHealth’s integrated model allows Optum to capture expanding healthcare service demand while reducing care costs for UnitedHealthcare, driving steady margin expansion. Supported by a 6.3% FCF yield and a 17.3x forward P/E, long-term secular growth in Medicare Advantage and health analytics provides clear tailwinds. Investors gain an industry leader trading at a compelling 20.7% margin of safety.
Bear Case
Elevated healthcare utilization rates across senior demographics may persistently push medical cost ratios higher, eroding underwriting profitability faster than premium rates can be repriced. Concurrently, tightening government reimbursement benchmarks and heightened regulatory scrutiny around Optum’s provider acquisitions could restrict growth and compress the stock’s valuation multiple.
03 — Fundamentals
Valuation Multiples
| Market Cap ($B) | 360.32 |
| Enterprise Value ($B) | — |
| EV / EBITDA | —x |
| P/E | 22.9x |
| Forward P/E | 17.3x |
| Forward Earnings Yield | 5.8% |
| P/FCF | 15.8x |
| FCF Yield | 6.3% |
Margins & Growth
| Revenue Growth (5Y) | 8.7% |
| Sales Growth YoY | 0.5% |
| Gross Margin | 0.0% |
| Operating Margin | 5.3% |
| Net Margin | 3.5% |
Balance Sheet & Returns
| Cash ($M) | 0 |
| Long-Term Debt ($M) | 68714 |
| Net Cash ($M) | -68714 |
| Years to Pay Debt | 4.3 |
| ROE | 14.6% |
| ROIC | 12.4% |
| 5-Yr Avg ROIC | 14.1% |
Capital Returns
| Dividend Yield | 2.24% |
| Payout Ratio | 65.97% |
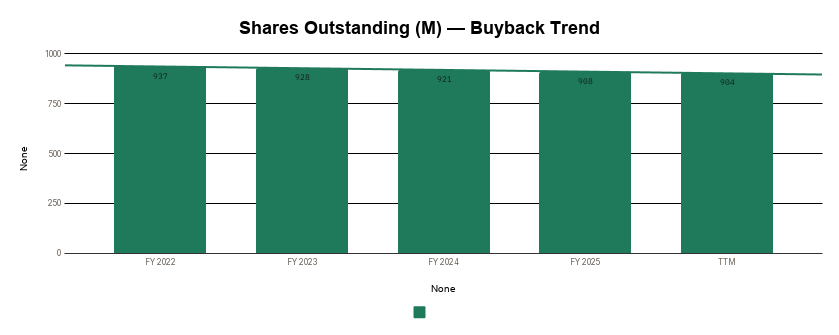
| Buybacks (Share Count Δ) | -0.9% |
| Avg. Distribution Yield | 3.2% |
What the Numbers Show
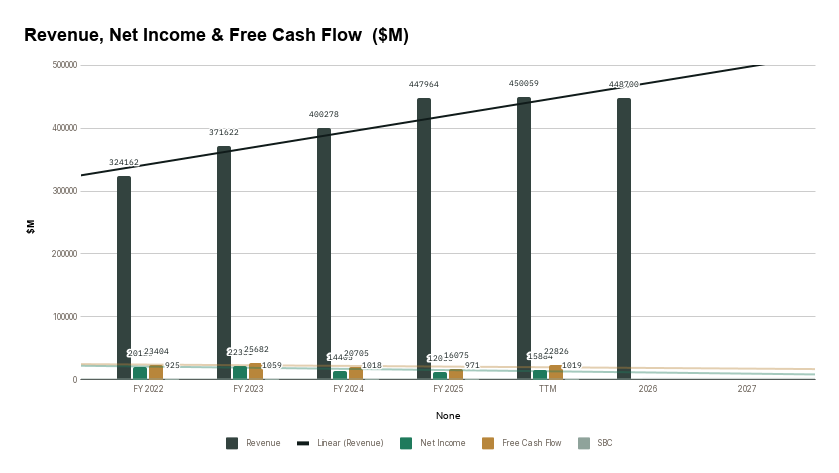
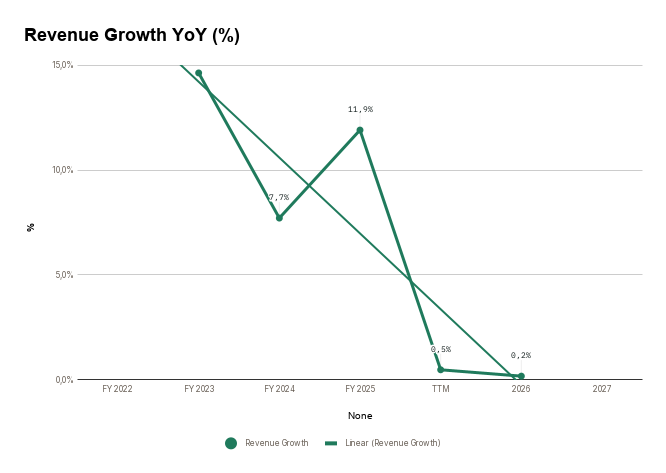
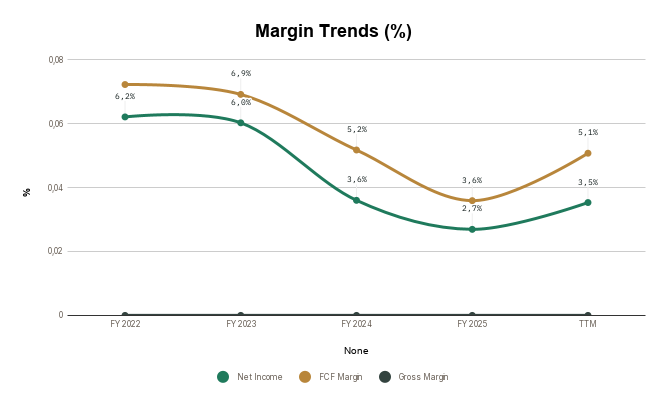
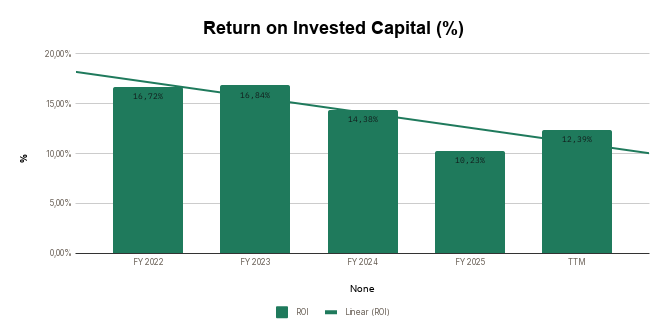
While UnitedHealth’s 5-year average revenue growth of 8.7% underscores its long-term expansion capacity, recent YoY sales growth decelerated to 0.5%, reflecting short-term headwinds in medical loss ratios and government reimbursement adjustments. Capital efficiency remains solid, evidenced by an ROE of 14.6% and an ROIC of 12.4%, though current ROIC sits slightly below its 5-year average of 14.1% due to elevated medical utilization costs and capital deployed into recent clinical acquisitions. Operational margins of 5.3% and net margins of 3.5% reflect the low-margin, high-volume nature of managed care premiums offset by higher-margin Optum service revenues. The balance sheet carries substantial leverage with $-68.7 billion in net cash, requiring 4.3 years of operating cash flow to fully retire debt, but this is comfortably sustained by a robust 6.3% FCF yield.
5-Year Trend — Charts
Revenue, Net Income & Free Cash Flow ($M)
Revenue Growth YoY (%)
Margin Trends (%)
Return on Invested Capital (%)
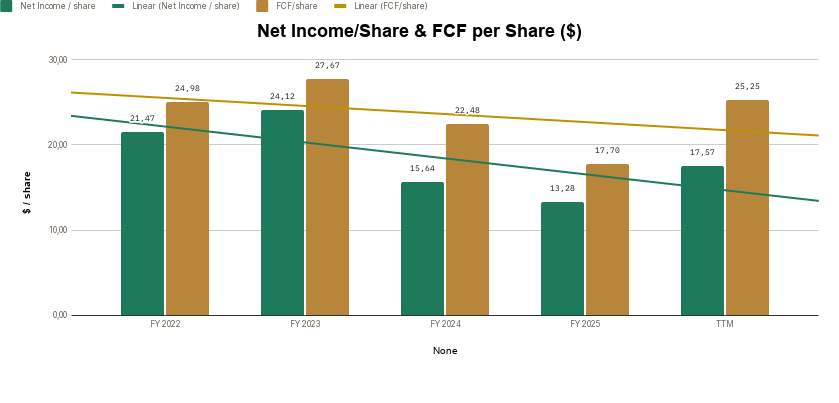
Net Income/Share & FCF per Share ($)
Shares Outstanding (M) — Buyback Trend
04 — Quality Scorecard
| CRITERION | VALUE / ASSESSMENT | PASS |
| Revenue Growth | 8,7% | ✔ |
| Market Potential / Industry Growth | 18,24% | ✔ |
| Quality of Revenues | Recurring | High |
| Product / Process Development | Yes | Better |
| Research & Development | — | Average |
| High Gross Margins | 0,0% | ✔ |
| Profit Margins | 5,6% | ✔ |
| Maintaining Profit Margins | Yes | ✔ |
| Margins vs. Competition | — | Better |
| Pricing Power | Yes | ✔ |
| Debt Structure | 4,33 | Average |
| Rates of Return (ROIC / ROE) | 14,1% | ✔ |
| Management Depth | — | Very competent |
| Culture, Reputation & Labor Relations | — | Good |
| MOAT / Competitive Advantage | Efficient Scale | Wide / Formidable |
| MOAT Trend | — | Widening |
| FCF / Share Growth | 3,4% | ✔ |
| Returns Capital (Dividends/Buybacks) | 3,2% | ✔ |
| QUALITY SCORE | — | 75.0 / 100 |
Scale: 80-100 Exceptional · 60-79 Strong · 40-59 Mixed · Below 40 Weak.
What’s Driving the Score
The score is anchored by strong marks on Rates of Return (ROIC / ROE) (10%), Pricing Power (8%), and FCF / Share Growth (8%) — three of its most heavily weighted criteria. Together, the criteria with a clear pass or fail account for roughly 45% of the total weighting — the rest sit at a middling score rather than a firm strength or weakness.
Want to see my exact Fair Value calculation, the Quality Scorecard, and download the Excel model for this stock?
Enter your email to unlock the rest of this breakdown for free.
05 — Valuation
Key Assumptions
| Country | United States |
| Business Risk | Safe |
| Discount Rate | 9.55% |
| Revenue Growth — Base | 5.0% |
| Revenue Growth — Bull | 7.0% |
| Revenue Growth — Bear | 3.0% |
| FCF Margin (2032E) | 5.5% |
| Exit P/E Multiple (Base) | 20.0x |
Scenario Analysis
| CASE | PROB. | REV. GROWTH | EXIT P/E | INTRINSIC VALUE |
| Base Case | 60% | 5.0% | 20.0x | $499.84 |
| Bull Case | 20% | 7.0% | 22.0x | $684.29 |
| Bear Case | 20% | 3.0% | 18.0x | $346.03 |
Probability-Weighted Fair Value
| FAIR VALUE $505.96 |
NET CASH / SHARE $-76.55 |
MARGIN OF SAFETY 20.7% |
EXPECTED ANN. RETURN 13.6% |
What This Means
With the stock trading at $401.43 against a base fair value of $499.84 ($505.96 blended fair value), the current entry point offers a 20.7% margin of safety and a projected 13.6% annual return. The scenario distribution, anchored by a $346.03 bear case and a $684.29 bull case, demonstrates attractive upside optionality relative to downside risks.
Sensitivity Analysis
Intrinsic Value ($ / share) — Discount Rate × Exit P/E
| DISC. RATE ↓ / EXIT P/E → | 16x | 20x | 24x |
| 8.6% | 422.49 | 528.11 | 633.73 |
| 9.6% | 399.87 | 499.84 | 599.80 |
| 10.5% | 378.65 | 473.31 | 567.98 |
Intrinsic Value ($ / share) — Revenue CAGR × FCF Margin
| REV. CAGR ↓ / FCF MARGIN → | 3.5% | 5.5% | 7.5% |
| 4.0% | 293.01 | 470.92 | 648.84 |
| 5.0% | 311.41 | 499.84 | 688.26 |
| 6.0% | 330.71 | 530.16 | 729.62 |
Revenue CAGR ± 1 pt and 2032 FCF margin ± 2 pts around the Base Case; discount rate and exit P/E held at Base Case.
06 — My Take
Overall Conclusion
UnitedHealth Group is a top-tier healthcare compounder, reflected in its Quality Score of 75.0/100 driven by strong capital returns and an unmatched competitive moat. The current valuation generates a clear Buy signal, providing a 20.7% margin of safety against its fair value of $505.96. The single biggest risk to the thesis is government intervention in Medicare Advantage reimbursement rates alongside heightened scrutiny on Optum’s vertical integration. However, with the stock trading at a reasonable 17.3x forward P/E and offering a 6.3% free cash flow yield, the risk-reward profile is highly favorable. The bottom line is that value investors are getting a rare opportunity to acquire a market-dominant compounder at a significant discount.
Investment Thesis Check
☑ Is it cheap? (Margin of safety at current price)
☑ Is it a good business? (Quality Score reflects durable fundamentals)
☑ Who is running it? (Management track record checked)
What did I miss? (Deliberately looked for the counter-argument)
3 Sources of Returns
☑ Revenue / Earnings Growth
☑ P/E Expansion
☑ Buybacks and Dividends
| VERDICT BUY |
Entry Execution & Support Levels
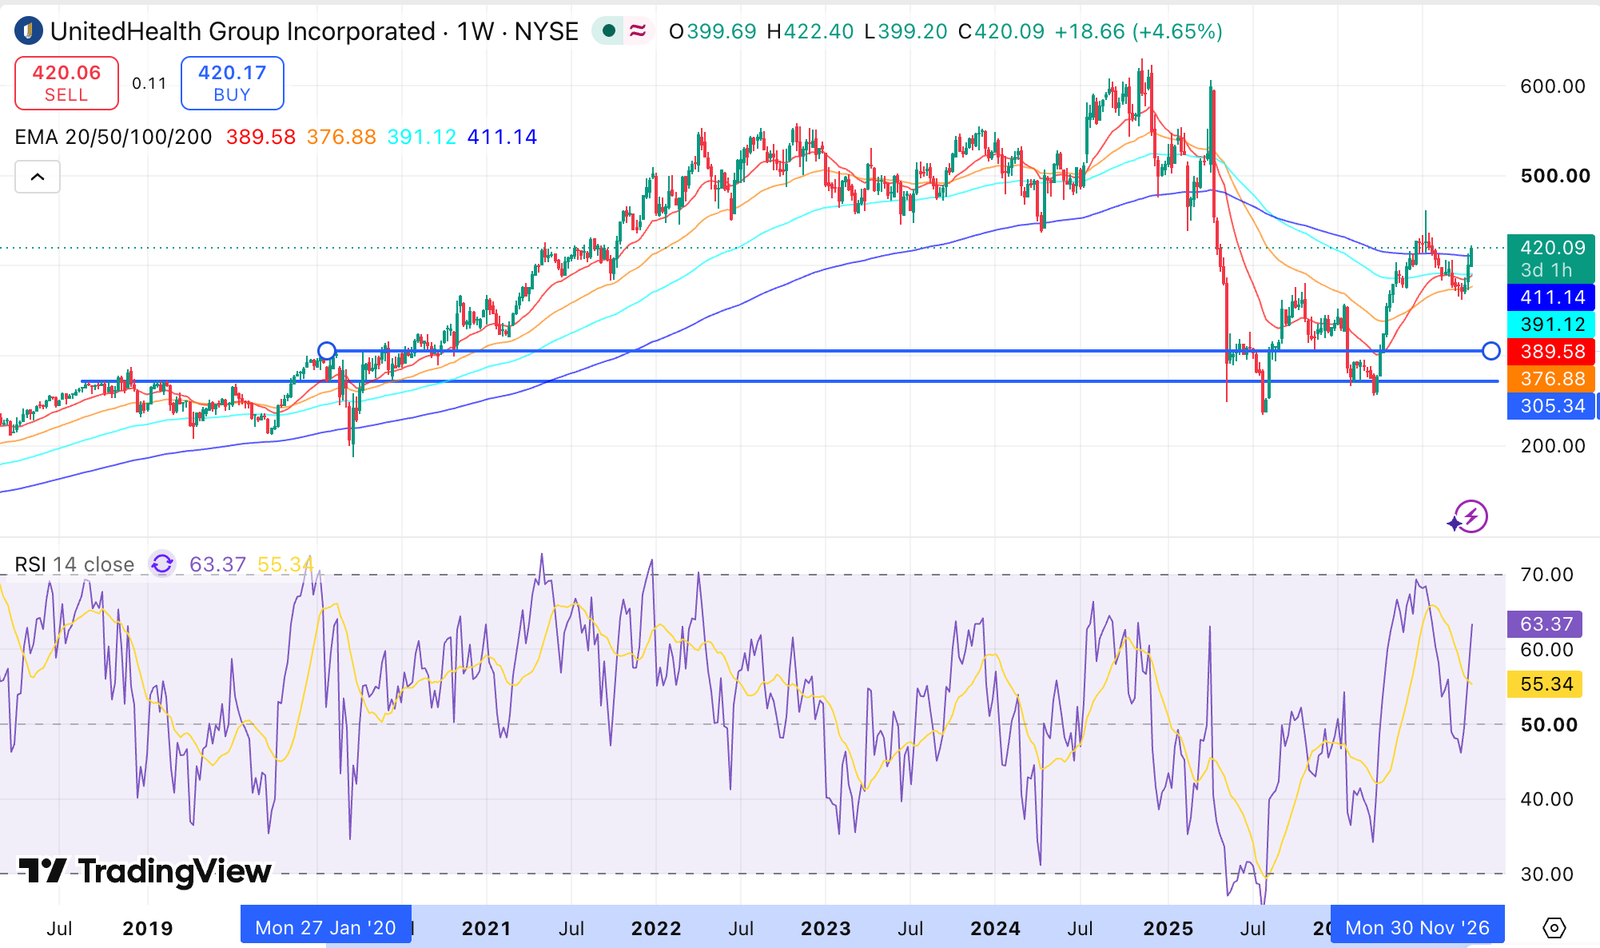
Looking at our preferred weekly timeframe, there is not much information about the stock. Some smal support levels starting at 305$ and 260$ from the bottom of 2025.
Personal Take
UNH is a buy for a starter position. Since we have loaded shares under 300$ and have a core position already, we continue to hold the stock because it´s a leader in their sector, a compounder still at a fair valuation. For us to buy, we need to see lower prices, probably under 300$ to get our interest.