
A repeatable process for buying great companies at a fair price.
Most investing mistakes come from two places: buying a weak business because it looks cheap, or paying too much for a great one. Our framework is built to avoid both. The same four questions, in the same order, for every company, turned into a 0–100 Quality Score, a fair value and one clear signal.
Why we say no to most of the market.
You do not need to follow thousands of tickers. The framework works as a filter, so our attention, and our money, only goes to businesses that pass every step.
-
10,000+
Listed companies worldwide
The full universe of stocks, including the unprofitable, the heavily indebted and the value traps.
-
~300
Profitable businesses with an edge
Companies with real free cash flow, a lasting competitive advantage and high returns on capital.
-
67
The MoneyJourney Watchlist
The companies we follow closely, each with a fair value, a margin of safety and a live signal.
-
●
Our real-money portfolio
When a Watchlist company trades clearly below our fair value, we buy with our own money and publish the move the same day.
How we analyse every company, step by step.
Every report and every Watchlist score follows the same checklist. The order matters: a great price on a weak business is still a weak business.
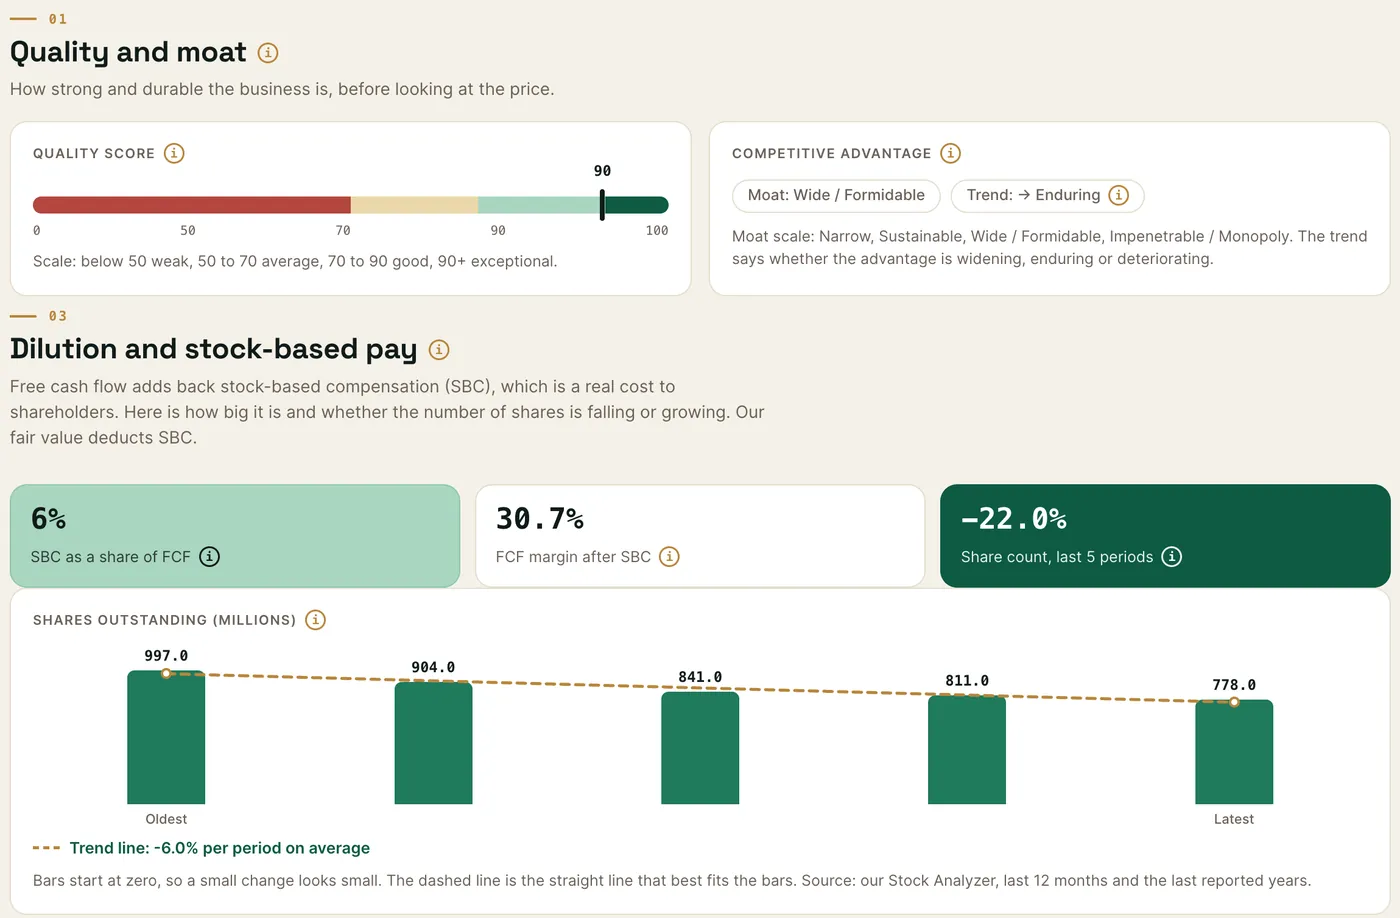
Is it a great business?
Plain-English check: “If a competitor had ten billion dollars, could it take this company’s customers?”
Quality comes first. We look at how lasting the competitive advantage is, how the fundamentals have developed over time, whether owners are being diluted, whether the people in charge own a real stake, and where the business can go next. All of it becomes one Quality Score from 0 to 100.
🛡 How this protects you: It keeps you away from one-hit wonders and from cheap companies that stay cheap for a reason.
What is it worth?
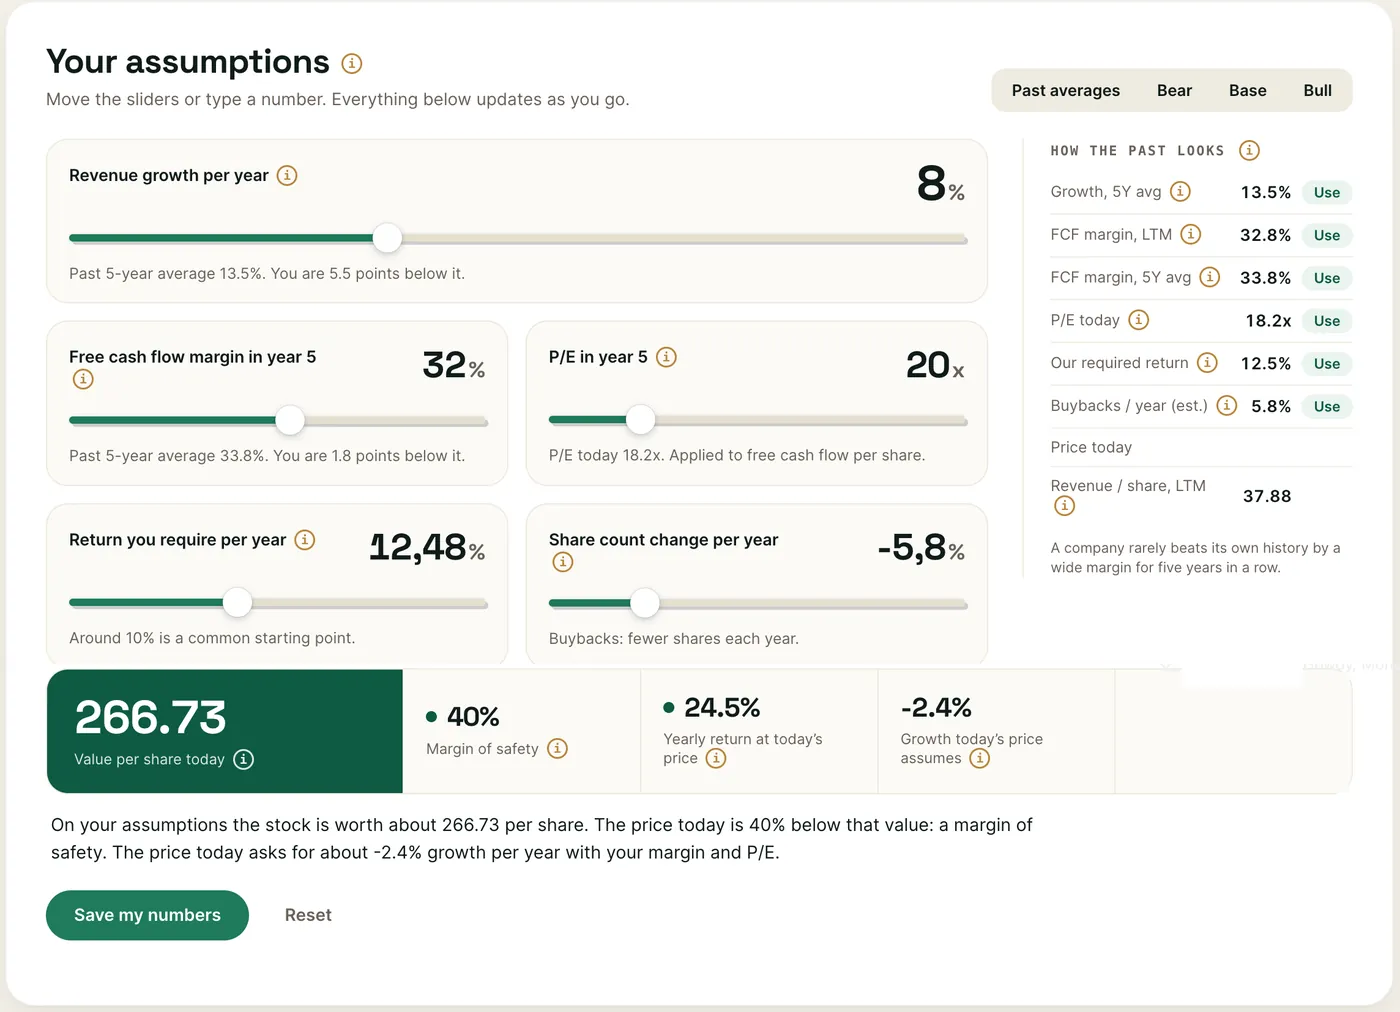
Plain-English check: “What would a sensible owner pay for the whole business today?”
We estimate a fair value with a cash-flow model and show every assumption, with a bear, a base and a bull case instead of one price target. Stock-based pay is deducted, because it is a real cost to the owners.
🛡 How this protects you: You see the range of outcomes, not a single number to anchor on, and you can change any assumption yourself.
Is the price right?
Plain-English check: “If growth slows down, am I still buying at a discount?”
The margin of safety measures how far today’s price sits below our fair value. Quality and margin of safety combine into the MJ Score, and the score gives one of five signals, from Strong Buy to Sell.
- Strong Buy 90+
- Good Buy 70+
- Buy 50+
- Hold 0+
- Sell <0
🛡 How this protects you: A clear signal stops you from chasing a great company at any price.
How the MJ Score works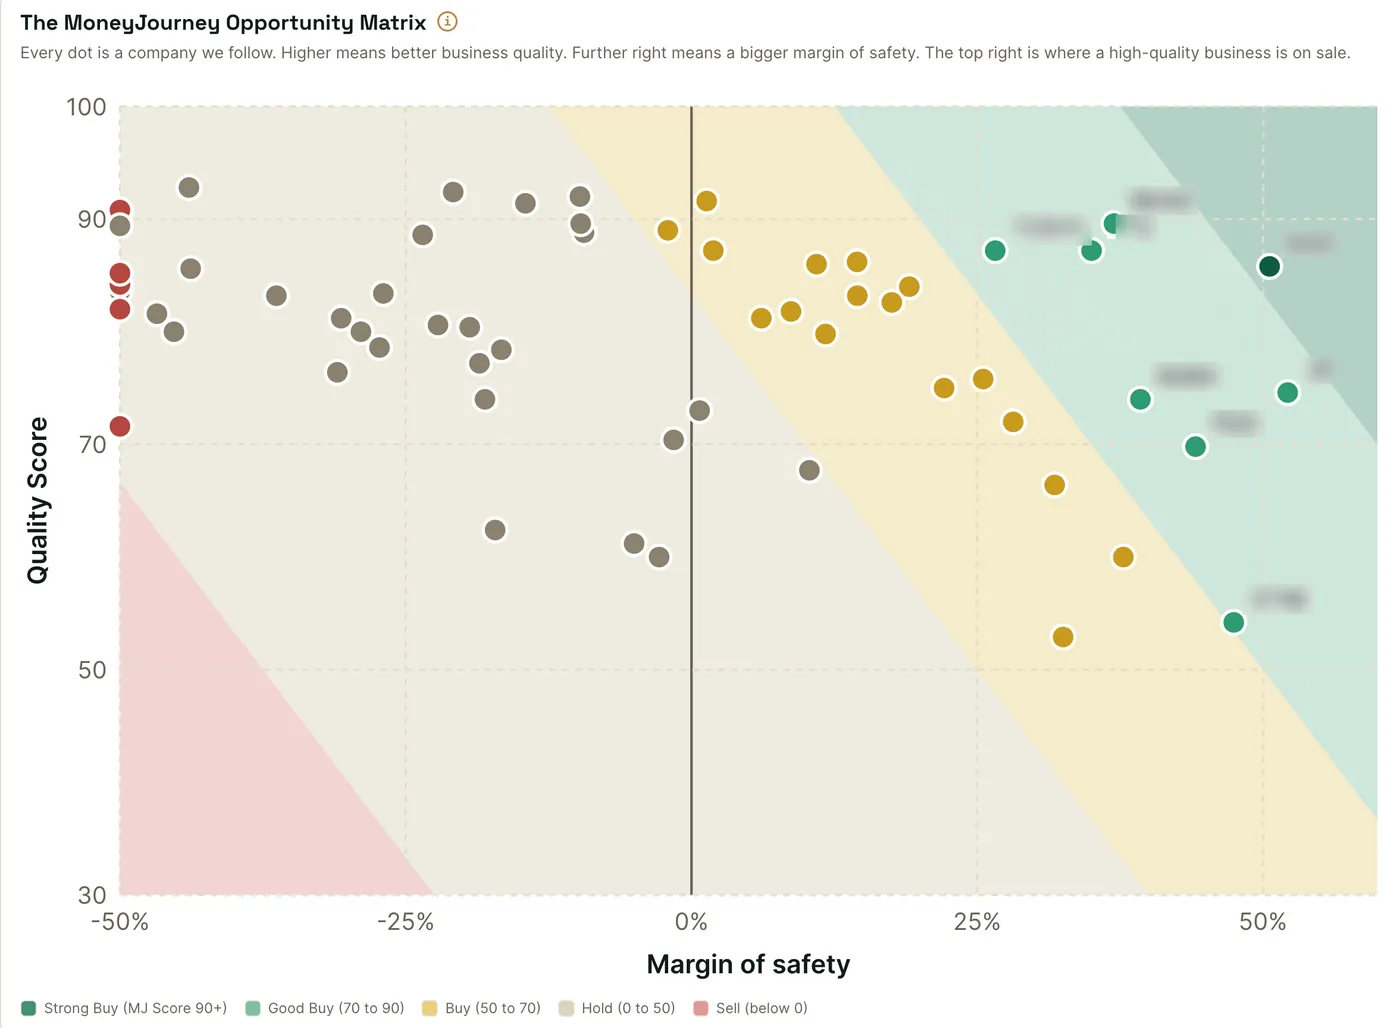
How much to own?
Plain-English check: “If we are wrong, how much does it hurt?”
Good research still needs discipline. Position size follows conviction inside clear guardrails, every holding has a written thesis, and every move is published. How the portfolio is built is shared with Pro members.
🛡 How this protects you: No single idea can sink the portfolio, and nothing is hidden after the fact.
See what Pro includesThe same questions, with our own money.
In 2022 big technology companies were out of favour and their prices fell hard. The framework looked past the headlines: the moats were intact, the cash flows were real and the prices sat well below our fair values. We bought with our own money, and we have asked the same questions in every market since. Returns below are live from our portfolio.

Past performance is not a guide to future results.
Why we invest this way.
Quality at a discount is how we aim to lose less and compound more. No method removes risk or promises returns, so here is the reasoning.
Quality compounds.
A business with a lasting advantage keeps growing its value year after year. Time works for you instead of against you.
The discount protects.
Buying below fair value, the margin of safety, leaves room for being wrong. If a forecast misses, a good price can still keep the loss small.
Cheap alone is a trap.
A low price without quality often stays low. Quality tells us whether a discount is an opportunity or a warning.
Decades of research find that profitable, financially sound companies have been rewarded over the long run. Quality does not win every year, and nobody can promise results. That is why we start with the business, then ask about the price.
Read the studies (checked 8 November 2026)
- Asness, Frazzini and Pedersen, Quality Minus Junk (2019)High-quality stocks earned high risk-adjusted returns, although their prices were only modestly higher.Tested with long-short portfolios, not stock picks.
- Novy-Marx, The Other Side of Value (2013)More profitable firms earned higher average returns than unprofitable ones, despite higher valuations. Profitability predicted returns about as well as cheapness did.Profit measured as gross profits to assets.
- Fama and French, A five-factor asset pricing model (2015)Adding profitability and investment improved their model. In their sample, the value factor became redundant.One sample, and the model has critics.
- MSCI, Factor Focus: QualityThe MSCI World Quality Index beat MSCI World by about 1.8 percentage points a year from December 1999 to June 2025.Index provider data, and it notes periods of underperformance.
- CFA Institute blog, Patience Pays (December 2025)The quality index beat MSCI World over every 10-year period since 1998, and fell less than growth shares in the 2008 crisis.Written by a manager with a quality bias. Quality lagged growth for six quarters in 2021 and 2022.
Three limits we state openly
- These studies measure groups of quality companies, not the MJ Score. They show the idea has been rewarded, not that our picks will be.
- Quality can lag for a while. Even the sources above report stretches of underperformance, so patience is part of the method.
- Price still matters. A great company bought too dear can disappoint, which is why the discount is half of our score.
What we do not do.
- We do not predict where a share price will go next.
- We do not promise returns, or show them as if they were guaranteed.
- We do not take payment to cover a company or to put it on the Watchlist.
- We do not tell you what to buy. A signal shows how attractive a company looks on this method, today.
Do it yourself in Excel, or let us do the heavy lifting.
Use the same framework on your own with the free template, or get our finished scores, valuations and portfolio moves with Pro.
The MoneyJourney Excel template
Analyse companies from scratch, on your own time, with the same framework we use.
- The Excel model: Enter the financial statements and run your own scenarios. It calculates the score with all the weights.
- The weekly newsletter: New deep dives and Watchlist updates in your inbox.
- Time needed: Several hours of research and data entry per company.
Enter your email to get the free template:
Every company scored, valued and kept up to date
We have already run this framework on all 67 companies on the Watchlist, and we keep it current.
- The full Watchlist: Every MJ Score, fair value, margin of safety and the top picks.
- Our real-money portfolio: Every holding in %, every buy and sell the same day, and the stocks on our radar.
- Deep dives and the calculator: Every paid report, with our bear, base and bull cases.
- Alerts and the Pro Discord: A daily alert email and a place to ask questions.
$97 a year ($8.08 a month) or $14 a month · $0 today · cancel anytime · 7-day refund on your first payment
MoneyJourney shares fundamental research, valuation models and our own portfolio for educational purposes. Nothing here is personal financial, tax or legal advice. Past positions, including the ones named on this page, do not guarantee future results. Do your own research before you invest.