
MONEYJOURNEY RESEARCH TEMPLATE
Broadridge Financial Solutions Inc (BR)

QUALITY VALUE INVESTING RESEARCH
| SECTOR Technology — Information Technology Services |
PRICE AT ANALYSIS $165.45 |
MARKET CAP $18.68B |
DATE October 10, 2026 |
| FAIR VALUE $194.10 |
MARGIN OF SAFETY 14.8% |
QUALITY SCORE 87.2 / 100 |
SIGNAL Buy |
| TL;DR — EXECUTIVE SUMMARY Verdict — Buy — shares trade at $165.45 against a probability-weighted fair value of $194.10, a margin of safety of 14.8% and an expected annual return of 14.7%. Business quality — Broadridge is an exceptional financial infrastructure leader (Quality Score 87.2) generating a 17.0% ROIC with dominant regulatory moats and predictable recurring revenues. Key risk — Adverse regulatory changes to proxy fee structures represent the top threat; investors should accumulate shares given the Buy signal and margin of safety. |
01 — MoneyJourney Introduction
This report follows the MoneyJourney quality value investing framework: understand the business first, assess its quality and durability, calculate a reasoned estimate of intrinsic value, and only act with a margin of safety. The goal is a repeatable, transparent process — not a prediction.
Broadridge provides essential infrastructure to the global financial services industry, generating highly predictable fee-based revenues backed by entrenched switching costs. Value investors may find a compelling entry point as a market-leading business with a high return on invested capital trades at a reasonable multiple relative to its cash generation capability.
02 — The Business
What They Do & How They Make Money
Spun off from ADP in 2007, Broadridge Financial Solutions has grown into a core technology and operations backbone for global capital markets and corporate governance. The business operates primarily through two segments: Investor Communication Solutions (ICS) and Global Technology and Operations (GTO). The ICS segment generates revenue by processing and distributing proxy materials, regulatory communications, shareholder reports, and customer statements on behalf of public issuers and financial intermediaries. The GTO segment provides software solutions that automate trading, clearing, settlement, and portfolio management workflows for institutional broker-dealers and asset managers. Its client base includes virtually all major financial institutions, mutual fund complexes, and corporate issuers in North America. While geographically concentrated in North America, Broadridge continues to expand its footprint across Europe and Asia-Pacific. Together, these complementary divisions create an interconnected financial technology platform handling trillions of dollars in daily transactions and critical shareholder communications.
Competitive Landscape
Broadridge occupies a near-monopoly position in North American proxy processing, where its vast distribution network creates an overwhelming advantage over potential entrants. In capital markets technology, it competes directly with large software and financial technology providers such as SS&C Technologies, Fidelity National Information Services (FIS), and Fiserv. SS&C and FIS offer broad portfolio management and middle-office software, but Broadridge differentiates itself through deeper integration in post-trade processing and governance infrastructure. In transfer agent and issuer services, Broadridge competes against Computershare, leveraging its superior digital technology stack to win share. Broadridge’s pricing power remains exceptionally durable because its services are mission-critical and mandated by financial regulations. Overall, its competitive position is holding firm in wealth management software and actively strengthening in core proxy and post-trade operations.
PEER COMPARISON
| COMPANY | OPERATING MARGIN | ROIC |
| Broadridge Financial Solutions Inc (BR) | 17.6% | 17.0% |
| SS&C Technologies Holdings Inc (SSNC) | 27.5% | 8.5% |
| Fidelity National Information Services Inc (FIS) | 19.5% | 6.5% |
| Fiserv Inc (FI) | 28.0% | 9.5% |
| Computershare Ltd (CMSQY) | 26.0% | 13.0% |
Revenue Breakdown
BY SEGMENT
Investor Communication Solutions (ICS) generates roughly 75% of total revenue, while Global Technology and Operations (GTO) accounts for approximately the remaining 25%.
BY GEOGRAPHY
North America represents approximately 85% to 90% of total revenue, with international operations across Europe and Asia-Pacific contributing the remaining 10% to 15%.
Competitive Advantages & Moat
- Brand Strength — Limited
- Network Effects — Strong network effects exist in its proxy platform, which seamlessly connects thousands of corporate issuers, institutional brokerages, and retail investors.
- Switching Costs — High switching costs stem from deep integration into institutional back-offices and clearing workflows, yielding client retention rates above 97%.
- Cost Advantages / Scale — Significant scale advantages allow Broadridge to process billions of regulatory communications and trades at a unit cost rivals cannot match.
- Regulatory / IP Protection — SEC regulations mandating shareholder communications and governing fee structures create a high structural barrier to entry.
Risk Factors
- Regulatory changes by financial authorities affecting proxy fee schedules or digital distribution rules could compress operating margins.
- A prolonged cyclical decline in capital markets trading volumes or new securities issuances could slow transaction-based revenue growth.
- Integration challenges or execution missteps with large client enterprise software deployments could pressure technology segment margins.
Bull Case
Broadridge leverages its structural monopoly in proxy communications to drive predictable top-line growth while expanding margins through its wealth management software platform. High ROIC and robust free cash flows allow for steady debt reduction and capital returns, driving mid-teens annualized investor returns.
Bear Case
Regulatory intervention compresses proxy processing fee structures while capital markets volatility suppresses transaction volumes. Under this scenario, revenue growth decelerates into low single digits and margin expansion stalls, capping valuation upside.
03 — Fundamentals
Valuation Multiples
| Market Cap ($B) | 18.68 |
| Enterprise Value ($B) | 21.79 |
| EV / EBITDA | 11.9x |
| P/E | 17.2x |
| Forward P/E | 14.3x |
| Forward Earnings Yield | 7.0% |
| P/FCF | 14.6x |
| FCF Yield | 6.8% |
Margins & Growth
| Revenue Growth (5Y) | 7.0% |
| Sales Growth YoY | 8.5% |
| Gross Margin | 31.8% |
| Operating Margin | 17.6% |
| Net Margin | 15.0% |
Balance Sheet & Returns
| Cash ($M) | 404 |
| Long-Term Debt ($M) | 3258 |
| Net Cash ($M) | -2854 |
| Years to Pay Debt | 2.5 |
| ROE | 40.9% |
| ROIC | 17.0% |
| 5-Yr Avg ROIC | 15.9% |
Capital Returns
| Dividend Yield | 2.60% |
| Payout Ratio | 40.62% |
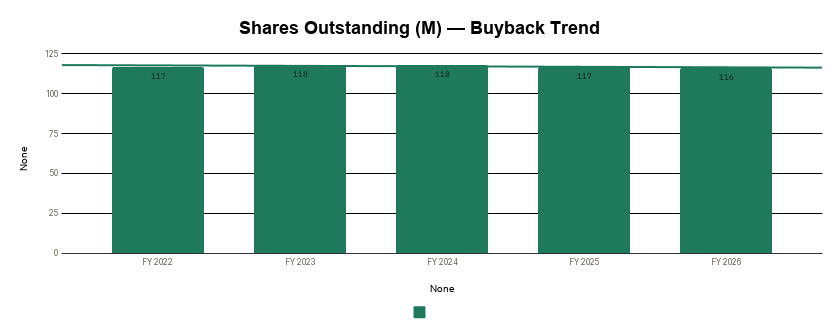
| Buybacks (Share Count Δ) | -0.2% |
| Avg. Distribution Yield | 3.6% |
What the Numbers Show
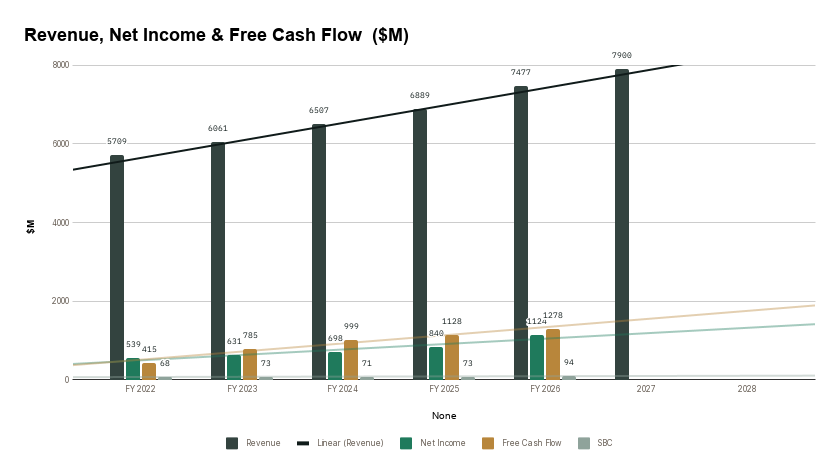
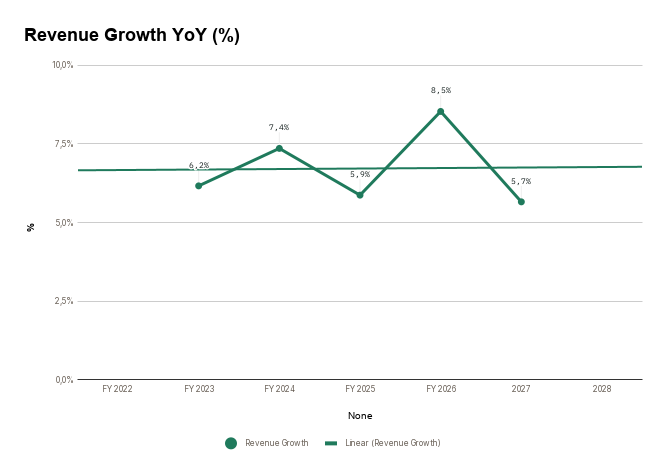
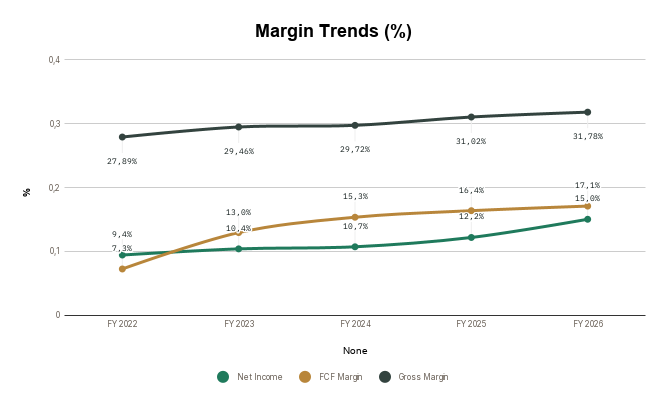
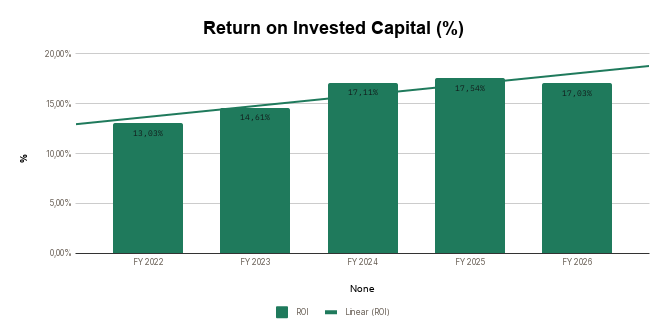
Broadridge’s fundamentals reflect stellar capital efficiency and compounding power, evidenced by an ROE of 40.9% and an ROIC of 17.0%, which exceeds its 5-year average of 15.9%. Top-line momentum is healthy, with YoY sales growth of 8.5% outpacing its 5-year CAGR of 7.0%, indicating steady organic expansion alongside contract wins. Operating margins of 17.6% and net margins of 15.0% demonstrate strong conversion of gross profits (31.8%) into free cash flow, aided by operating leverage in its technology infrastructure. The balance sheet carries $2.85 billion in net debt, but financial leverage is well-controlled, requiring just 2.5 years of cash flows to fully satisfy obligations given a robust 6.8% FCF yield.
5-Year Trend — Charts
Revenue, Net Income & Free Cash Flow ($M)
Revenue Growth YoY (%)
Margin Trends (%)
Return on Invested Capital (%)
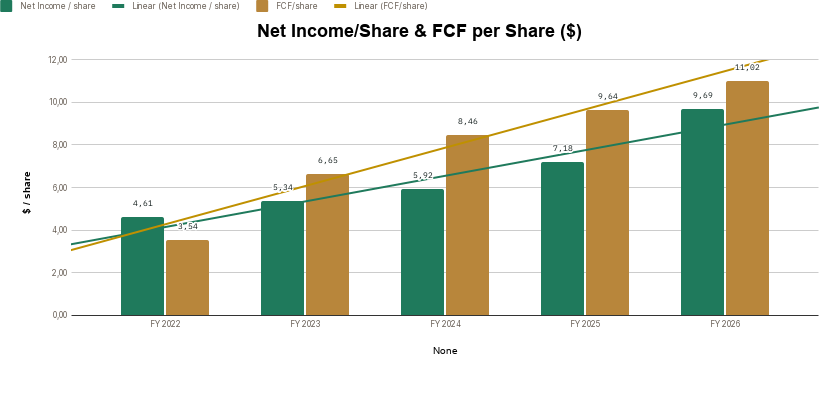
Net Income/Share & FCF per Share ($)
Shares Outstanding (M) — Buyback Trend
04 — Quality Scorecard
| CRITERION | VALUE / ASSESSMENT | PASS |
| Revenue Growth | 7,0% | ✔ |
| Market Potential / Industry Growth | 9,87% | ✔ |
| Quality of Revenues | Recurring | High |
| Product / Process Development | Yes | Better |
| Research & Development | — | Better |
| High Gross Margins | 30,0% | ✔ |
| Profit Margins | 13,8% | ✔ |
| Maintaining Profit Margins | Yes | ✔ |
| Margins vs. Competition | — | Better |
| Pricing Power | Yes | ✔ |
| Debt Structure | 2,54 | Better |
| Rates of Return (ROIC / ROE) | 15,9% | ✔ |
| Management Depth | — | Very competent |
| Culture, Reputation & Labor Relations | — | Good |
| MOAT / Competitive Advantage | Proprietary Technology | Impenetrable / Monopoly |
| MOAT Trend | — | Widening |
| FCF / Share Growth | 35,8% | ✔ |
| Returns Capital (Dividends/Buybacks) | 3,6% | ✔ |
| QUALITY SCORE | — | 87.2 / 100 |
Scale: 80-100 Exceptional · 60-79 Strong · 40-59 Mixed · Below 40 Weak.
What’s Driving the Score
The score is anchored by strong marks on Rates of Return (ROIC / ROE) (10%), Pricing Power (8%), and FCF / Share Growth (8%) — three of its most heavily weighted criteria. Together, the criteria with a clear pass or fail account for roughly 45% of the total weighting — the rest sit at a middling score rather than a firm strength or weakness.
05 — Valuation
Key Assumptions
| Country | United States |
| Business Risk | Low |
| Discount Rate | 11.79% |
| Revenue Growth — Base | 6.0% |
| Revenue Growth — Bull | 8.0% |
| Revenue Growth — Bear | 4.0% |
| FCF Margin (2032E) | 15.0% |
| Exit P/E Multiple (Base) | 22.0x |
Scenario Analysis
| CASE | PROB. | REV. GROWTH | EXIT P/E | INTRINSIC VALUE |
| Base Case | 60% | 6.0% | 22.0x | $192.72 |
| Bull Case | 20% | 8.0% | 24.0x | $251.70 |
| Bear Case | 20% | 4.0% | 20.0x | $140.65 |
Probability-Weighted Fair Value
| FAIR VALUE $194.10 |
NET CASH / SHARE $-25.29 |
MARGIN OF SAFETY 14.8% |
EXPECTED ANN. RETURN 14.7% |
What This Means
With the stock trading at $165.45 against a Base Fair Value of $192.72 and a Bull scenario of $251.70, the market provides a favorable 14.8% margin of safety. Even under a conservative Bear scenario ($140.65), downside appears contained by a reasonable 14.3x Forward P/E multiple and resilient recurring revenue streams.
Sensitivity Analysis
Intrinsic Value ($ / share) — Discount Rate × Exit P/E
| DISC. RATE ↓ / EXIT P/E → | 18x | 22x | 26x |
| 10.8% | 166.41 | 203.40 | 240.38 |
| 11.8% | 157.68 | 192.72 | 227.76 |
| 12.8% | 149.48 | 182.69 | 215.91 |
Intrinsic Value ($ / share) — Revenue CAGR × FCF Margin
| REV. CAGR ↓ / FCF MARGIN → | 13.0% | 15.0% | 17.0% |
| 5.0% | 154.81 | 181.16 | 207.50 |
| 6.0% | 164.83 | 192.72 | 220.61 |
| 7.0% | 175.34 | 204.84 | 234.35 |
06 — My Take
Overall Conclusion
Broadridge is an elite compounder, as confirmed by its 87.2/100 Quality Score, strong capital returns (17.0% ROIC), and dominant market positioning in investor communications. The current market price of $165.45 offers a clear Buy signal, supported by a 14.8% Margin of Safety and an expected annual return of 14.7%. The single biggest risk to this setup is a material regulatory shift that alters proxy delivery fee structures or pass-through rules. However, given its 6.8% FCF yield and durable moats, the stock represents a high-quality value opportunity for long-term investors seeking low-volatility capital appreciation.
Investment Thesis Check
☑ Is it cheap? (Margin of safety at current price)
☑ Is it a good business? (Quality Score reflects durable fundamentals)
☑ Who is running it? (Management track record checked)
What did I miss? (Deliberately looked for the counter-argument)
3 Sources of Returns
☑ Revenue / Earnings Growth
☑ P/E Expansion
☑ Buybacks and Dividends
| VERDICT BUY |
Want to Know the Exact Moment We Pull the Trigger? Join MoneyJourney Pro.
Reading a report is step one—executing with discipline is how you build wealth. Inside MoneyJourney Pro, you don’t have to guess which stocks are in the Buy Zone today or wonder when we are adding to our positions.
Real-time notifications in #portfolio-moves whenever we buy, trim, or sell a stock with our own money.
See every stock we hold, our exact cost basis, portfolio % weights, and which holdings are Actionable Buys Today.
Unlock every 0–100 MJ Quality Score, Fair Value estimate, Margin of Safety %, and technical entry zone.