
MONEYJOURNEY RESEARCH
Novo Nordisk A/S (NVO)

QUALITY VALUE INVESTING RESEARCH
| SECTOR Healthcare — Drug Manufacturers – General |
PRICE AT ANALYSIS $40.70 |
MARKET CAP $135.68B |
DATE November 11, 2026 |
| FAIR VALUE $75.46 |
MARGIN OF SAFETY 46.1% |
QUALITY SCORE 87.2 / 100 |
SIGNAL Good Buy |
| TL;DR — EXECUTIVE SUMMARY Verdict — Good Buy — shares trade at $40.70 against a probability-weighted fair value of $75.46, a margin of safety of 46.1% and an expected annual return of 22.9%. Business quality — Novo Nordisk is an elite biopharmaceutical leader (Quality Score 87.2) generating a 42.6% ROIC and 48.4% operating margins through its dominant metabolic disease franchise. Key risk — Investors should watch US drug pricing regulation and Eli Lilly competition, maintaining a buy stance given the attractive 46.1% Margin of Safety. |
01 — MoneyJourney Introduction
This report follows the MoneyJourney quality value investing framework: understand the business first, assess its quality and durability, calculate a reasoned estimate of intrinsic value, and only act with a margin of safety. The goal is a repeatable, transparent process — not a prediction.
Novo Nordisk presents a compelling opportunity for quality value investors as a dominant global biopharmaceutical leader whose valuation currently offers a substantial margin of safety. Trading at just 10.2x earnings despite superior capital returns and durable structural demand in chronic disease management, the stock offers an attractive entry point into a premier compounder.
02 — The Business
What They Do & How They Make Money
Founded in Denmark over a century ago, Novo Nordisk A/S is a global healthcare titan specializing in chronic disease care, primarily focused on diabetes, obesity, and rare blood and endocrine disorders. The enterprise operates principally through two commercial business segments: Diabetes and Obesity Care, and Rare Diseases. The Diabetes and Obesity Care division accounts for the overwhelming majority of revenues, monetizing proprietary GLP-1 receptor agonists, modern insulins, human insulins, and specialized injection devices. The Rare Diseases segment generates revenue through specialized therapeutics for hemophilia, growth hormone deficiencies, and hormone replacement therapies. Novo Nordisk distributes its products globally via pharmaceutical wholesalers, retail pharmacies, hospital networks, and national health authorities. Geographically, revenues are split between North America Operations and International Operations, with the United States representing its largest single market. By combining research capabilities in peptide engineering with large-scale biologic manufacturing, Novo Nordisk operates as a highly integrated and scale-advantaged healthcare leader.
Competitive Landscape
In diabetes and obesity care, Novo Nordisk’s primary direct competitor is Eli Lilly, with whom it shares a dominant market duopoly; while Eli Lilly challenges on clinical efficacy in next-generation molecules, Novo Nordisk holds superior global distribution and deep manufacturing infrastructure. In traditional and modern insulins, the company competes with Sanofi and Eli Lilly, retaining a leading market share grounded in established brand loyalty and delivery device ecosystems. In rare blood disorders, Novo Nordisk faces specialized competition from Roche and Pfizer, maintaining a defensible niche in hemophilia care. Overall, Novo Nordisk’s competitive position is firm to strengthening, reinforced by massive capital investment into manufacturing capacity and unmatched scale in peptide therapeutics.
PEER COMPARISON
| COMPANY | OPERATING MARGIN | ROIC |
| Novo Nordisk A/S (NVO) | 48.4% | 42.6% |
| Eli Lilly and Company (LLY) | 32.5% | 21.4% |
| Sanofi (SNY) | 21.8% | 11.2% |
| AstraZeneca PLC (AZN) | 23.1% | 13.5% |
Revenue Breakdown
BY SEGMENT
Diabetes and Obesity Care generates approximately 90% of total company revenue, dominated by GLP-1 therapies and insulins. The Rare Diseases segment contributes the remaining roughly 10% of revenue through blood and endocrine disorder therapies.
BY GEOGRAPHY
North America Operations accounts for approximately 55% of global sales, while International Operations across Europe, Asia, and emerging markets generates roughly 45%.
Competitive Advantages & Moat
- Brand Strength — Strong brand reputation and physician trust established over a century of leadership in diabetes care and insulin delivery devices.
- Network Effects — Limited
- Switching Costs — High patient and physician switching costs driven by chronic treatment reliance, proprietary injection device familiarity, and specific dosing protocols.
- Cost Advantages / Scale — Significant scale and cost advantages in complex biologic peptide synthesis and specialized mass-scale manufacturing infrastructure.
- Regulatory / IP Protection — Extensive patent protection, clinical trial data barriers, and regulatory complexities governing follow-on biologics and biosimilars.
Risk Factors
- Government price regulations and aggressive rebate demands from pharmacy benefit managers in the US could compress net realized prices.
- Intense competition and potential clinical advances from Eli Lilly or next-generation drug developers could erode market share in obesity.
- Manufacturing bottlenecks or execution delays in scaling API production could constrain near-term volume fulfillment and revenue growth.
Bull Case
Novo Nordisk commands a premier position in the expanding global diabetes and obesity markets, backed by outstanding capital efficiency (42.6% ROIC) and robust 48.4% operating margins. Massive ongoing manufacturing investments ensure long-term volume growth, while strong cash flows easily support ongoing R&D and debt service. At a 10.2x P/E and a 46.1% discount to fair value, investors gain access to a world-class compounder at a bargain price.
Bear Case
Legislative price caps and aggressive healthcare payer negotiations in North America could permanently pressure gross margins below historic levels. Additionally, competing dual- or triple-agonist treatments from Eli Lilly and others could gain clinical superiority, curbing Novo’s growth rate. Heavy ongoing capital expenditure commitments could also compress returns on capital if market growth decelerates faster than anticipated.
03 — Fundamentals
Valuation Multiples
| Market Cap ($B) | 135.68 |
| Enterprise Value ($B) | 149.07 |
| EV / EBITDA | 5.4x |
| P/E | 10.2x |
| Forward P/E | 11.9x |
| Forward Earnings Yield | 8.4% |
| P/FCF | 12.3x |
| FCF Yield | 8.1% |
Margins & Growth
| Revenue Growth (5Y) | 18.0% |
| Sales Growth YoY | 9.3% |
| Gross Margin | 83.3% |
| Operating Margin | 48.4% |
| Net Margin | 33.5% |
Balance Sheet & Returns
| Cash ($M) | 6878 |
| Long-Term Debt ($M) | 16225 |
| Net Cash ($M) | -9347 |
| Years to Pay Debt | 0.6 |
| ROE | 59.0% |
| ROIC | 42.6% |
| 5-Yr Avg ROIC | 63.1% |
Capital Returns
| Dividend Yield | 4.33% |
| Payout Ratio | 36.87% |
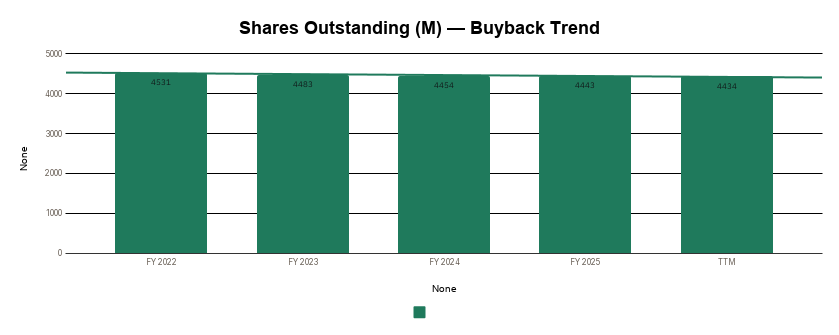
| Buybacks (Share Count Δ) | -0.5% |
| Avg. Distribution Yield | 4.8% |
What the Numbers Show
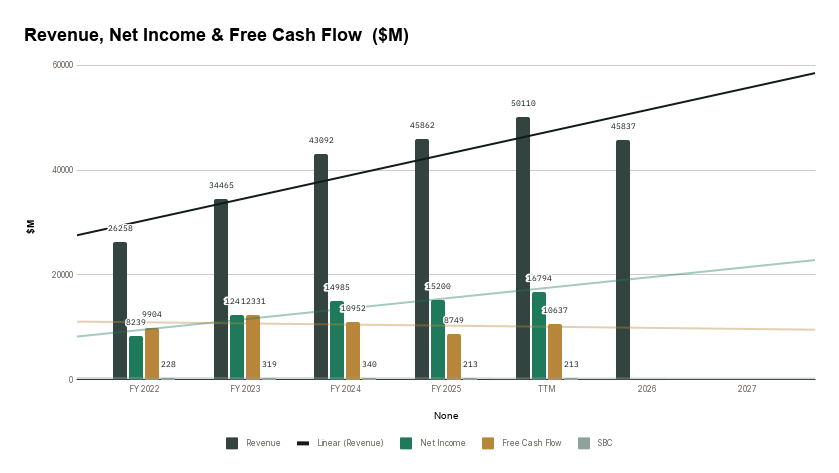
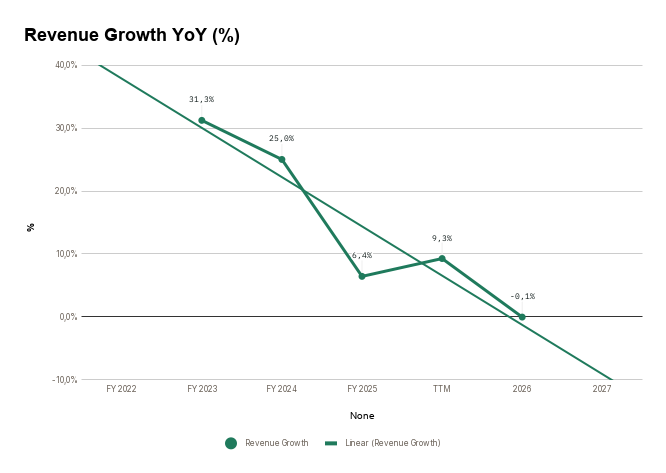
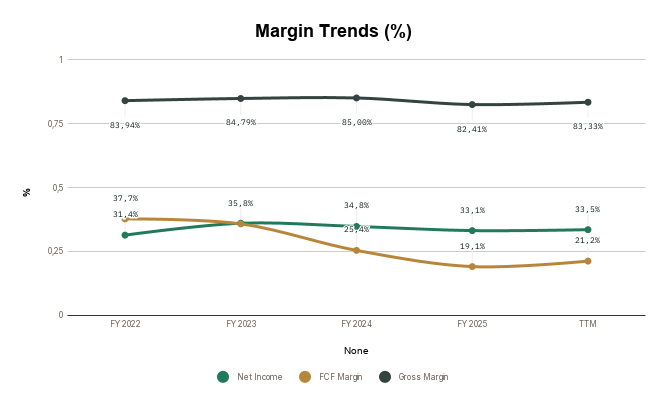
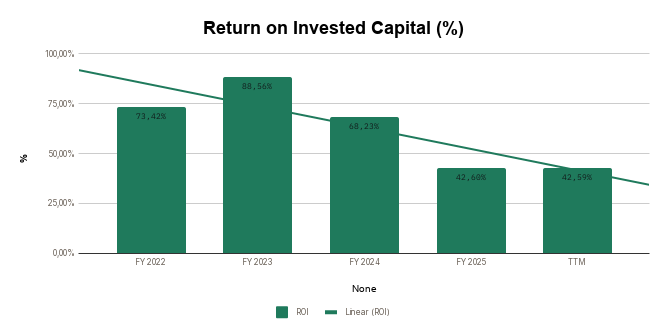
Novo Nordisk displays elite business fundamentals, characterized by an extraordinary 83.3% gross margin and a 48.4% operating margin that reflect immense pricing power and manufacturing scale. Capital efficiency remains world-class with a 59.0% ROE and a 42.6% ROIC; while current ROIC is below its 5-year average of 63.1% due to massive capital expenditures for GLP-1 capacity, returns remain exceptional. Revenue growth of 9.3% YoY and 18.0% over five years confirms steady expansion driven by organic patient demand rather than financial engineering. Despite net debt of $9.35 billion, the balance sheet is exceptionally strong, requiring just 0.6 years of cash flow to fully retire debt while generating an impressive 8.1% free cash flow yield.
5-Year Trend — Charts
Revenue, Net Income & Free Cash Flow ($M)
Revenue Growth YoY (%)
Margin Trends (%)
Return on Invested Capital (%)
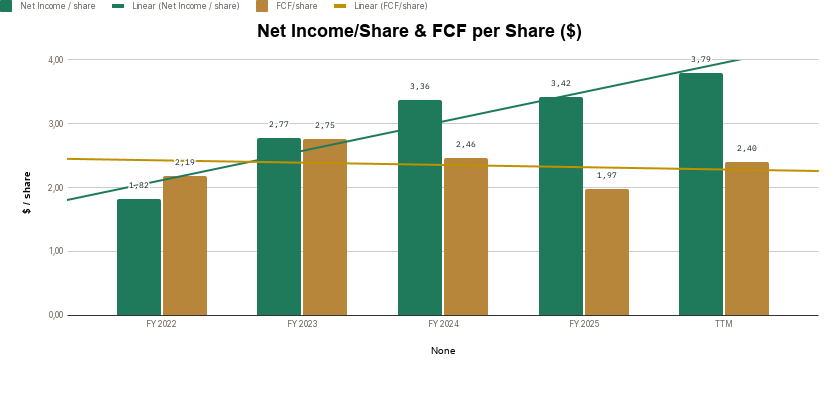
Net Income/Share & FCF per Share ($)
Shares Outstanding (M) — Buyback Trend
04 — Quality Scorecard
| CRITERION | VALUE / ASSESSMENT | PASS |
| Revenue Growth | 18,0% | ✔ |
| Market Potential / Industry Growth | 0,23% | ✔ |
| Quality of Revenues | Recurring | High |
| Product / Process Development | Yes | Better |
| Research & Development | — | Better |
| High Gross Margins | 83,9% | ✔ |
| Profit Margins | 27,8% | ✔ |
| Maintaining Profit Margins | Yes | ✔ |
| Margins vs. Competition | — | Better |
| Pricing Power | Yes | ✔ |
| Debt Structure | 0,56 | Better |
| Rates of Return (ROIC / ROE) | 63,1% | ✔ |
| Management Depth | — | Very competent |
| Culture, Reputation & Labor Relations | — | Good |
| MOAT / Competitive Advantage | Proprietary Technology | Wide / Formidable |
| MOAT Trend | — | Enduring |
| FCF / Share Growth | 21,5% | ✔ |
| Returns Capital (Dividends/Buybacks) | 4,8% | ✔ |
| QUALITY SCORE | — | 87.2 / 100 |
Scale: 80-100 Exceptional · 60-79 Strong · 40-59 Mixed · Below 40 Weak.
What’s Driving the Score
The score is anchored by strong marks on Rates of Return (ROIC / ROE) (10%), Pricing Power (8%), and FCF / Share Growth (8%) — three of its most heavily weighted criteria. Together, the criteria with a clear pass or fail account for roughly 45% of the total weighting — the rest sit at a middling score rather than a firm strength or weakness.
05 — Valuation
Key Assumptions
| Country | Denmark |
| Business Risk | Low |
| Discount Rate | 11.13% |
| Revenue Growth — Base | 6.0% |
| Revenue Growth — Bull | 8.0% |
| Revenue Growth — Bear | 4.0% |
| FCF Margin (2032E) | 30.0% |
| Exit P/E Multiple (Base) | 18.0x |
Scenario Analysis
| CASE | PROB. | REV. GROWTH | EXIT P/E | INTRINSIC VALUE |
| Base Case | 60% | 6.0% | 18.0x | $74.38 |
| Bull Case | 20% | 8.0% | 20.0x | $100.28 |
| Bear Case | 20% | 4.0% | 16.0x | $53.87 |
Probability-Weighted Fair Value
| FAIR VALUE $75.46 |
NET CASH / SHARE $-2.81 |
MARGIN OF SAFETY 46.1% |
EXPECTED ANN. RETURN 22.9% |
What This Means
Trading at $40.70 against an estimated Fair Value of $75.46, Novo Nordisk offers a 46.1% Margin of Safety and an expected annual return of 22.9%. With the current price sitting well below even the conservative Bear Case scenario ($53.87), the market is pricing in an overly pessimistic long-term trajectory relative to the Base ($74.38) and Bull ($100.28) valuation cases.
Sensitivity Analysis
Intrinsic Value ($ / share) — Discount Rate × Exit P/E
| DISC. RATE ↓ / EXIT P/E → | 14x | 18x | 22x |
| 10.1% | 61.08 | 78.53 | 95.98 |
| 11.1% | 57.85 | 74.38 | 90.91 |
| 12.1% | 54.82 | 70.49 | 86.15 |
Intrinsic Value ($ / share) — Revenue CAGR × FCF Margin
| REV. CAGR ↓ / FCF MARGIN → | 28.0% | 30.0% | 32.0% |
| 5.0% | 65.47 | 70.22 | 74.96 |
| 6.0% | 69.36 | 74.38 | 79.40 |
| 7.0% | 73.43 | 78.75 | 84.06 |
06 — My Take
Overall Conclusion
Novo Nordisk is an exceptional biopharmaceutical enterprise, evidenced by a high Quality Score of 87.2/100 driven by elite ROIC (42.6%), thick operating margins (48.4%), and fortress debt coverage. The valuation framework yields a clear ‘Good Buy’ signal, highlighted by a 46.1% Margin of Safety and an 8.1% FCF yield at a modest 10.2x trailing P/E. The primary risk to the thesis stems from potential US regulatory pricing interventions and intense head-to-head competition from Eli Lilly. Nevertheless, for value investors seeking high-quality compounders, the current discount offers an outstanding risk-reward profile.
Investment Thesis Check
☑ Is it cheap? (Margin of safety at current price)
☑ Is it a good business? (Quality Score reflects durable fundamentals)
☑ Who is running it? (Management track record checked)
What did I miss? (Deliberately looked for the counter-argument)
3 Sources of Returns
☑ Revenue / Earnings Growth
☑ P/E Expansion
☑ Buybacks and Dividends
| VERDICT GOOD BUY |