
MONEYJOURNEY RESEARCH TEMPLATE
Fair Isaac Corp (FICO)

QUALITY VALUE INVESTING RESEARCH
| SECTOR Technology — Software – Application |
PRICE AT ANALYSIS $614.92 |
MARKET CAP $13.32B |
DATE September 29, 2026 |
| FAIR VALUE $823.88 |
MARGIN OF SAFETY 25.4% |
QUALITY SCORE 86.2 / 100 |
SIGNAL Good Buy |
01 — MoneyJourney Introduction
This report follows the MoneyJourney quality value investing framework: understand the business first, assess its quality and durability, calculate a reasoned estimate of intrinsic value, and only act with a margin of safety. The goal is a repeatable, transparent process — not a prediction.
A value investor might revisit Fair Isaac Corp due to its rare combination of an economic moat anchored in industry-standard credit scoring and robust pricing power, now trading at an enticing valuation relative to its high return profile. With strong business momentum and cash flow conversion, the company offers durable quality that stands out even in uncertain macroeconomic environments.
02 — The Business
What They Do & How They Make Money
Founded in 1956, Fair Isaac Corporation (FICO) is a pioneer in predictive analytics and decision management technology, best known for creating the ubiquitous consumer credit score. The company operates primarily through two main business divisions: Scores and Software. The Scores segment generates revenue through B2B algorithm licensing fees charged to credit bureaus, financial institutions, auto lenders, and mortgage origination channels whenever a consumer’s creditworthiness is evaluated, alongside direct-to-consumer scoring services. The Software segment provides enterprise analytics, fraud detection, customer engagement, and originations platforms via cloud subscriptions and traditional software licenses to financial institutions and businesses globally. FICO’s primary customer base consists of major commercial banks, credit card issuers, auto lenders, insurance companies, and mortgage market participants. Geographically, while the firm maintains a presence across the Americas, Europe, the Middle East, Africa, and Asia-Pacific, the vast majority of its revenue originates in the United States. Together, these divisions reinforce one another: high-margin, transaction-based Scores revenue yields exceptional cash flows that fund ongoing development and deployment of enterprise decisioning software.
Competitive Landscape
In credit scoring, FICO’s primary competitor is VantageScore, a joint venture created by the three major credit bureaus (Equifax, Experian, and TransUnion) to offer an alternative scoring model. Within enterprise software and analytics, FICO competes directly against decisioning software platforms offered by Experian, Equifax, Pegasystems, and specialized fraud solution providers. Despite bureau efforts to promote VantageScore, FICO maintains dominant market share and pricing power due to deep integration across institutional lending guidelines and securitization markets. While VantageScore has gained minor traction in specific sub-segments, FICO’s competitive positioning remains firm, with its pricing power actively strengthening its overall moat.
Revenue Breakdown
BY SEGMENT
Scores accounts for approximately 50% to 55% of total revenue, while the Software segment contributes the remaining roughly 45% to 50%.
BY GEOGRAPHY
The United States represents approximately 80% to 85% of total revenue, with international markets across the Americas, EMEA, and Asia-Pacific accounting for roughly 15% to 20%.
Competitive Advantages & Moat
- Brand Strength — Strong institutional brand recognition makes the FICO name synonymous with consumer creditworthiness across North America.
- Network Effects — Limited
- Switching Costs — Extremely high switching costs stem from deep operational embedding in banking decisioning infrastructure and automated lending workflows.
- Cost Advantages / Scale — Limited
- Regulatory / IP Protection — Regulatory guidelines and secondary mortgage market standards historically mandated FICO scores for conforming loans, creating an entrenched structural moat.
Risk Factors
- Regulatory interventions by government agencies or GSEs mandating alternative credit scoring models could weaken FICO’s structural monopoly and pricing power in mortgage underwriting.
- A heavily leveraged balance sheet with over $5 billion in net debt increases financial vulnerability during prolonged periods of elevated interest rates or severe credit contraction.
- A severe macroeconomic downturn leading to lower consumer credit application volumes would directly reduce transaction-based scoring revenue.
Bull Case
FICO’s dominant credit scoring monopoly enables sustained price increases that expand already impressive 52.1% operating margins. Coupled with growing cloud software adoption and aggressive share repurchases, the company can deliver exceptional earnings growth and high double-digit annualized shareholder returns.
Bear Case
Regulatory mandate shifts toward competing score models like VantageScore could destroy FICO’s pricing power and erode market share in mortgage originations. Combined with a leveraged balance sheet requiring 6.2 years of cash flows to retire net debt, operational headwinds could lead to significant multiple contraction.
03 — Fundamentals
Valuation Multiples
| Market Cap ($B) | 13.32 |
| Enterprise Value ($B) | 18.67 |
| EV / EBITDA | 14.8x |
| P/E | 17.8x |
| Forward P/E | 11.9x |
| Forward Earnings Yield | 8.4% |
| P/FCF | 14.2x |
| FCF Yield | 7.0% |
Margins & Growth
| Revenue Growth (5Y) | 14.9% |
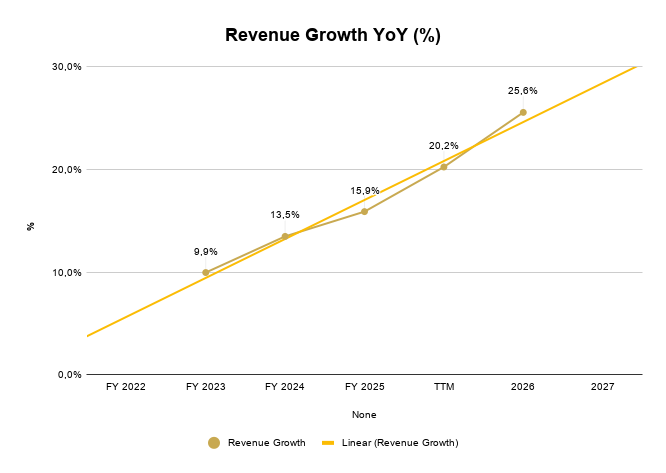
| Sales Growth YoY | 20.2% |
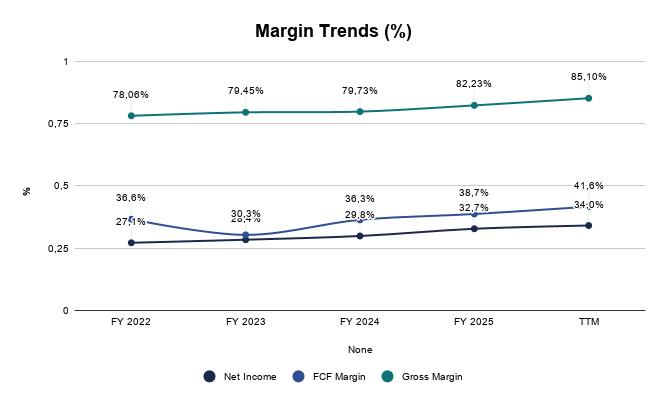
| Gross Margin | 85.1% |
| Operating Margin | 52.1% |
| Net Margin | 34.0% |
Balance Sheet & Returns
| Cash ($M) | 248 |
| Long-Term Debt ($M) | 5282 |
| Net Cash ($M) | -5034 |
| Years to Pay Debt | 6.2 |
| ROE | —% |
| ROIC | 65.0% |
| 5-Yr Avg ROIC | 51.8% |
Capital Returns
| Dividend Yield | —% |
| Payout Ratio | 0.00% |
| Buybacks (Share Count Δ) | -3.0% |
| Avg. Distribution Yield | 3.0% |
What the Numbers Show
FICO exhibits extraordinary capital efficiency and profitability, highlighted by an 85.1% gross margin and an operating margin of 52.1%, driven by the high-margin, capital-light nature of its Scores segment. The current ROIC of 65.0% expands upon its already formidable 5-year average of 51.8%, demonstrating that recent 20.2% YoY top-line growth is highly organic and accretive to capital efficiency rather than bought through dilutive reinvestment. Net margin stands at a strong 34.0%, converting top-line expansion into substantial free cash flow yield of 7.0%. However, the balance sheet carries $-5,034M in net cash due to aggressive debt-funded share repurchases, requiring roughly 6.2 years of debt paydown capacity, which remains manageable given the business’s highly predictable recurring cash flows.
5-Year Trend — Charts
Revenue, Net Income & Free Cash Flow ($M)

Revenue Growth YoY (%)
Margin Trends (%)
Return on Invested Capital (%)

Net Income/Share & FCF per Share ($)

Shares Outstanding (M) — Buyback Trend

04 — Quality Scorecard
| CRITERION | VALUE / ASSESSMENT | PASS |
| Revenue Growth | 14,9% | ✔ |
| Market Potential / Industry Growth | ? | ✔ |
| Quality of Revenues | Recurring | High |
| Product / Process Development | Yes | Average |
| Research & Development | — | Average |
| High Gross Margins | 80,9% | ✔ |
| Profit Margins | 36,7% | ✔ |
| Maintaining Profit Margins | Yes | ✔ |
| Margins vs. Competition | — | Better |
| Pricing Power | Yes | ✔ |
| Debt Structure | 6,18 | Average |
| Rates of Return (ROIC / ROE) | 51,8% | ✔ |
| Management Depth | — | Extraordinary |
| Culture, Reputation & Labor Relations | — | Average |
| MOAT / Competitive Advantage | Network Effect | Wide / Formidable |
| MOAT Trend | — | Enduring |
| FCF / Share Growth | 23,6% | ✔ |
| Returns Capital (Dividends/Buybacks) | 3,0% | ✔ |
| QUALITY SCORE | — | 86.2 / 100 |
Scale: 80-100 Exceptional · 60-79 Strong · 40-59 Mixed · Below 40 Weak.
What’s Driving the Score
The score is anchored by strong marks on Rates of Return (ROIC / ROE) (10%), Pricing Power (8%), and FCF / Share Growth (8%) — three of its most heavily weighted criteria. Together, the criteria with a clear pass or fail account for roughly 45% of the total weighting — the rest sit at a middling score rather than a firm strength or weakness.
Want to see my exact Fair Value calculation, the Quality Scorecard, and download the Excel model for this stock?
Enter your email to unlock the rest of this breakdown for free.
05 — Valuation
Key Assumptions

| Country | United States |
| Business Risk | Low |
| Discount Rate | 12.90% |
| Revenue Growth — Base (20% market share loss) | 12.0% |
| Revenue Growth — Bull (Duopoly but maintain market share) | 14.0% |
| Revenue Growth — Bear (50% market share loss) | 10.0% |
| FCF Margin (2032E) | 37.0% |
| Exit P/E Multiple (Base) | 20.0x |
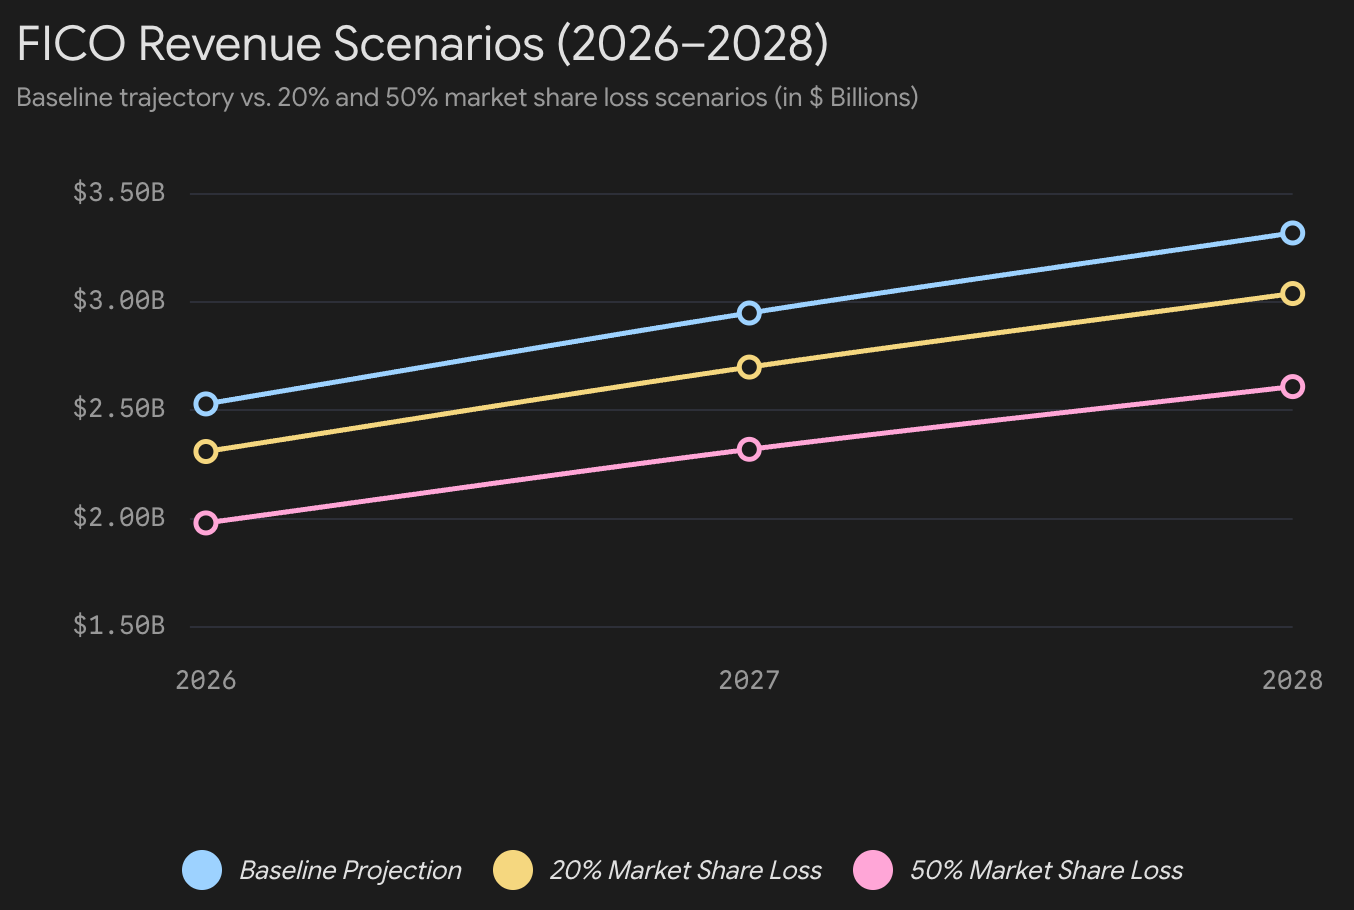
Scenario Analysis
| CASE | PROB. | REV. GROWTH | EXIT P/E | INTRINSIC VALUE |
| Base Case | 60% | 12.0% | 20.0x | $809.74 |
| Bull Case | 20% | 14.0% | 23.0x | $1129.83 |
| Bear Case | 20% | 10.0% | 18.0x | $560.32 |
Probability-Weighted Fair Value
| FAIR VALUE $823.88 |
NET CASH / SHARE $-231.95 |
MARGIN OF SAFETY 25.4% |
EXPECTED ANN. RETURN 18.2% |
What This Means
At $614.92, FICO trades at a compelling 25.4% margin of safety relative to its $823.88 intrinsic fair value, offering an estimated 18.2% annual return potential. With a forward P/E of just 11.9x and a bear-case scenario value of $560.32 sitting close to current price levels, the current risk/reward asymmetrical skew strongly favors long-term capital allocation.
Sensitivity Analysis
Base-case Discount Rate and Exit P/E ± one step, holding all else constant. Center cell (highlighted) matches the Base Case assumptions above — this is a single-scenario DCF sensitivity, not the same as the probability-weighted Fair Value shown above.
Intrinsic Value ($ / share)
| DISC. RATE ↓ / EXIT P/E → | 16x | 20x | 24x |
| 11.9% | 683.31 | 854.14 | 1024.97 |
| 12.9% | 647.79 | 809.74 | 971.69 |
| 13.9% | 614.41 | 768.01 | 921.61 |
06 — My Take
Overall Conclusion
FICO represents an exceptional business model, evidenced by its Quality Score of 86.2/100 driven by structural pricing power, stellar gross margins, and elite return on invested capital. The current valuation generates a clear ‘Good Buy’ signal with a 25.4% Margin of Safety, supported by an attractive 7.0% free cash flow yield. The primary threat to this investment thesis remains regulatory changes that could mandate or accelerate the adoption of competing scoring models like VantageScore in mortgage underwriting. Nevertheless, the combination of an entrenched operational standard and depressed forward earnings multiples offers investors a rare, high-quality opportunity. Investors can comfortably purchase a high-moat compounder with a highly favorable risk-reward asymmetry.
Investment Thesis Check
☑ Is it cheap? (Margin of safety at current price)
☑ Is it a good business? (Quality Score reflects durable fundamentals)
☐ Who is running it? (Management track record checked)
☐ What did I miss? (Deliberately looked for the counter-argument)
3 Sources of Returns
☑ Revenue / Earnings Growth
☑ P/E Expansion
☑ Buybacks and Dividends
| VERDICT GOOD BUY |
Technical Analysis

On a weekly timeframe we have entered the oversold area based on the RSI. We already crossed some support levels around 900$ and 700$.
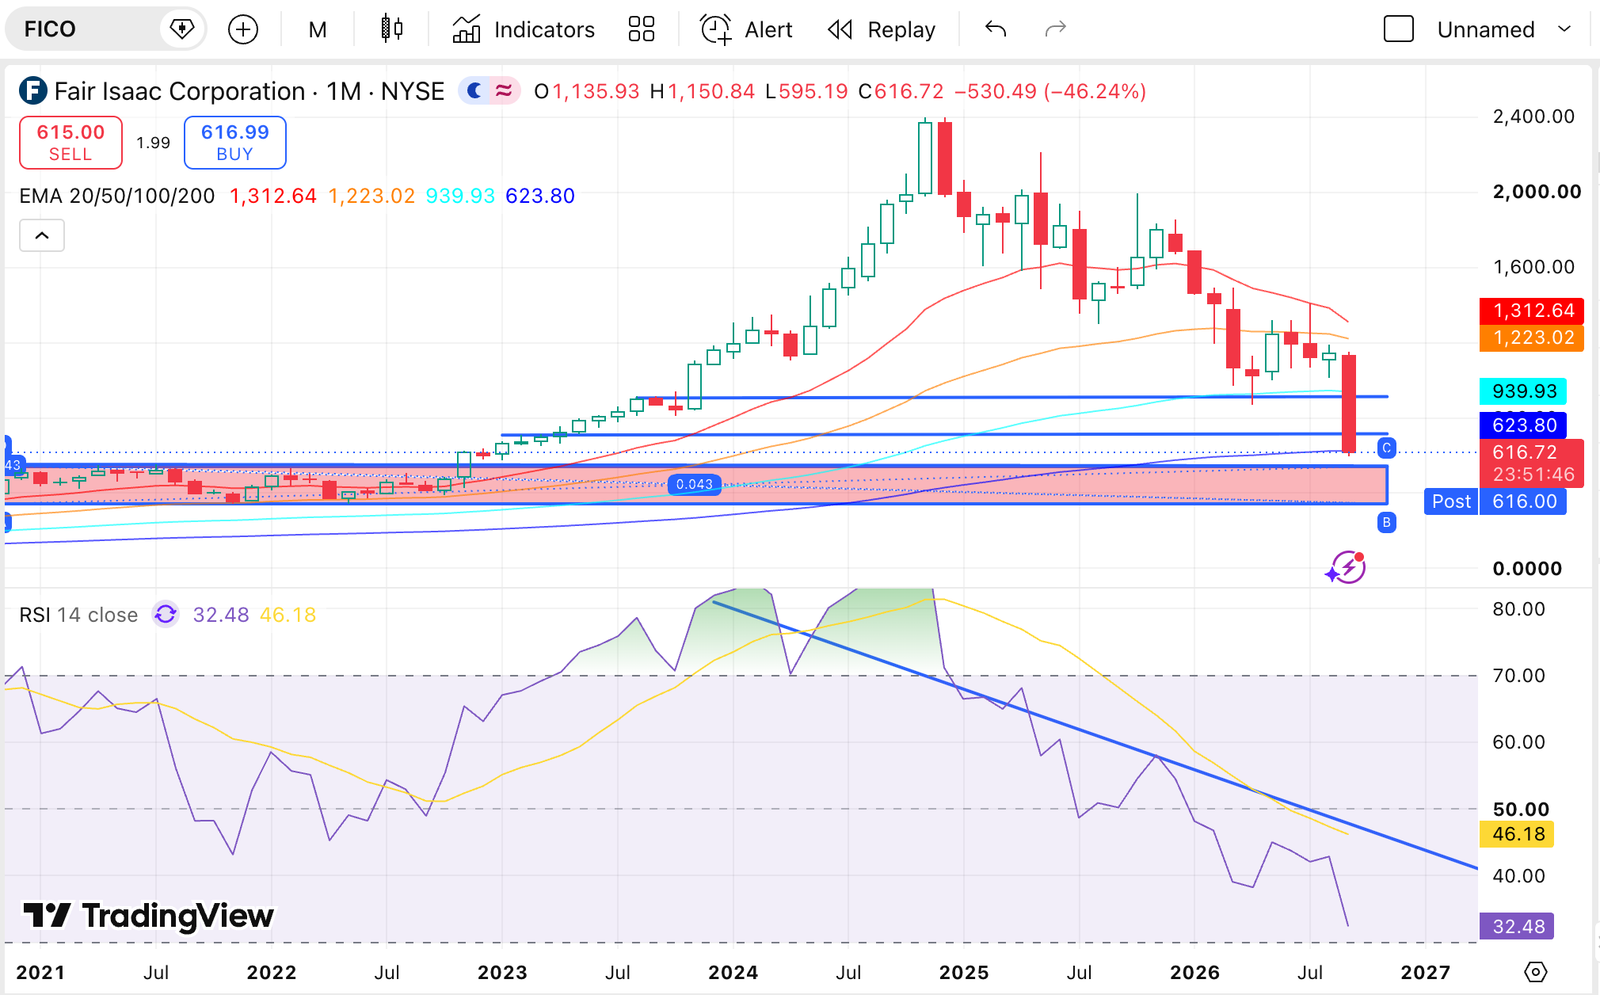
On a monthly timeframe we have touched the 200EMA level today at 620$ and it holds for today. Maybe it can act as major support and the stock holds here.
Personal Take
Investment thesis on FICO changed! The bear case is a reality. The major question is, how much market share will vantage score gain from FICO?
Monopoly is broken, but it’s a duopoly, with FICO in the top position. Regulatory MOAT disappears, but there are other competitive advantages that can protect FICO. In the end FICO can maintain their leadership position, and their market share loss will be minimal.
I´m conservative, and for my base case I assume that FICO can lose up to 20% market share on the mortgage score business and margins compressing to 37% from 41,6% TTM Even with that, investors who buy at this level can have a return above 18% which is a very good return.
For me FICO is a good buy at this level. Yes, investment thesis changed and the intrinsic value changed with that. But the margin of safety says this is a good BUY.