
MONEYJOURNEY RESEARCH TEMPLATE
Equifax Inc (EFX)

QUALITY VALUE INVESTING RESEARCH
| SECTOR Industrials — Consulting Services |
PRICE AT ANALYSIS $140.00 |
MARKET CAP $16.45B |
DATE October 4, 2026 |
| FAIR VALUE $221.76 |
MARGIN OF SAFETY 36.9% |
QUALITY SCORE 83.2 / 100 |
SIGNAL Good Buy |
| TL;DR — EXECUTIVE SUMMARY Verdict — Good Buy — shares trade at $140.00 against a probability-weighted fair value of $221.76, a margin of safety of 36.9% and an expected annual return of 18.9%. Business quality — Equifax is an exceptional data franchise (Quality Score 83.2/100) generating strong 55.5% gross margins through high-barrier consumer credit and verification networks. Key risk — The main risk is a prolonged mortgage slump; given the Good Buy signal and 36.9% margin of safety, long-term investors should build positions. |
01 — MoneyJourney Introduction
This report follows the MoneyJourney quality value investing framework: understand the business first, assess its quality and durability, calculate a reasoned estimate of intrinsic value, and only act with a margin of safety. The goal is a repeatable, transparent process — not a prediction.
Equifax presents a compelling opportunity for quality-value investors as its market price trades at a notable discount to intrinsic value despite its entrenched oligopoly position in credit data and verification services. An attractive forward P/E drop and a robust 6.7% free cash flow yield suggest the market is over-discounting cyclical mortgage volume headwinds.
02 — The Business
What They Do & How They Make Money
Equifax Inc. is a global data, analytics, and technology company that functions as one of the three major consumer credit reporting agencies in the United States. Founded in 1899 and headquartered in Atlanta, the company collects and manages credit, financial, and payroll information on over one billion consumers and tens of millions of businesses globally. The enterprise operates through three core divisions: Workforce Solutions, US Information Solutions (USIS), and International. Workforce Solutions is the company’s highest-growth engine, offering automated income and employment verifications through its proprietary Work Number database along with employer HR compliance services. USIS delivers traditional consumer and commercial credit reporting, identity verification, and fraud prevention services to mortgage lenders, banks, auto dealers, and utility providers. International delivers similar credit bureau, analytical, and risk-management solutions across Latin America, Europe, Canada, and the Asia-Pacific region. Revenue is generated primarily through transaction-based inquiry fees, subscription models, and multi-year enterprise contracts. Together, these complementary business units embed Equifax deeply into critical global lending, hiring, and risk-assessment workflows.
Competitive Landscape
Equifax operates in a entrenched global oligopoly alongside main credit bureau rivals Experian and TransUnion. Against Experian, Equifax maintains similar consumer bureau coverage in the US but possesses a significant competitive advantage in verification services via its unmatched proprietary Work Number employment database. TransUnion competes aggressively in risk analytics and consumer intelligence, though Equifax commands greater total scale and deeper penetration among enterprise mortgage and HR clients. Equifax enjoys substantial pricing power because credit checks and identity verifications represent critical, non-discretionary costs in underwriting processes. Supported by ongoing cloud infrastructure transformation, Equifax is holding its market share in core bureau services while actively strengthening its market position in workforce verification.
PEER COMPARISON
| COMPANY | OPERATING MARGIN | ROIC |
| Equifax Inc (EFX) | 18.5% | 8.9% |
| Experian plc (EXPGY) | 26.0% | 12.5% |
| TransUnion (TRU) | 17.0% | 5.5% |
| Fair Isaac Corporation (FICO) | 40.0% | 45.0% |
Revenue Breakdown
BY SEGMENT
Workforce Solutions accounts for approximately 40% to 45% of total revenue, US Information Solutions (USIS) generates roughly 35% to 40%, and the International segment accounts for the remaining approximately 20%.
BY GEOGRAPHY
Operations in North America generate approximately 80% to 85% of total revenue, while Latin America, Europe, and Asia-Pacific combined contribute the remaining roughly 15% to 20%.
Competitive Advantages & Moat
- Brand Strength — Deep institutional trust and long-standing industry relationships make Equifax a essential brand for financial underwriting.
- Network Effects — The Work Number database exhibits network effects as adding more employer payroll records increases the platform’s value to prospective verifiers.
- Switching Costs — High switching costs arise from deep technical integration of Equifax’s data feeds directly into automated bank and lender software workflows.
- Cost Advantages / Scale — Vast infrastructure scale enables Equifax to process billions of data records at low incremental costs that potential competitors cannot match.
- Regulatory / IP Protection — Strict regulatory hurdles under the Fair Credit Reporting Act create formidable barriers to entry for new market entrants.
Risk Factors
- A prolonged slowdown in mortgage origination volumes would constrain transaction-based inquiry revenues across both USIS and Workforce Solutions.
- Major cybersecurity breaches or restrictive data privacy regulations could inflict financial penalties and disrupt data ingestion pipelines.
- A heavy debt load of nearly $3.9 billion in net debt increases sensitivity to elevated interest rates and reduces balance sheet flexibility.
Bull Case
Equifax’s exclusive Work Number database forms an expanding, high-margin moat in verification services that competitors cannot easily duplicate. As the multi-year cloud transformation winds down, capital expenditures will shrink, releasing substantial free cash flow for debt reduction and capital return. Combined with a 36.9% margin of safety, investors benefit from strong downside protection and double-digit return potential.
Bear Case
Higher-for-longer interest rates could permanently damp lending activity, suppressing mortgage and auto inquiry volumes for an extended period. Meanwhile, managing nearly $3.9 billion in net debt reduces financial agility and limits share buybacks during market downturns. Additionally, emerging fintech verification tools and alternative credit databases could gradually chip away at long-term pricing power.
03 — Fundamentals
Valuation Multiples
| Market Cap ($B) | 16.45 |
| Enterprise Value ($B) | 21.88 |
| EV / EBITDA | 11.3x |
| P/E | 24.6x |
| Forward P/E | 13.8x |
| Forward Earnings Yield | 7.2% |
| P/FCF | 14.9x |
| FCF Yield | 6.7% |
Margins & Growth
| Revenue Growth (5Y) | 5.9% |
| Sales Growth YoY | 6.1% |
| Gross Margin | 55.5% |
| Operating Margin | 18.5% |
| Net Margin | 10.7% |
Balance Sheet & Returns
| Cash ($M) | 170 |
| Long-Term Debt ($M) | 4057 |
| Net Cash ($M) | -3887 |
| Years to Pay Debt | 5.6 |
| ROE | 14.6% |
| ROIC | 8.9% |
| 5-Yr Avg ROIC | 8.4% |
Capital Returns
| Dividend Yield | 1.60% |
| Payout Ratio | 35.52% |
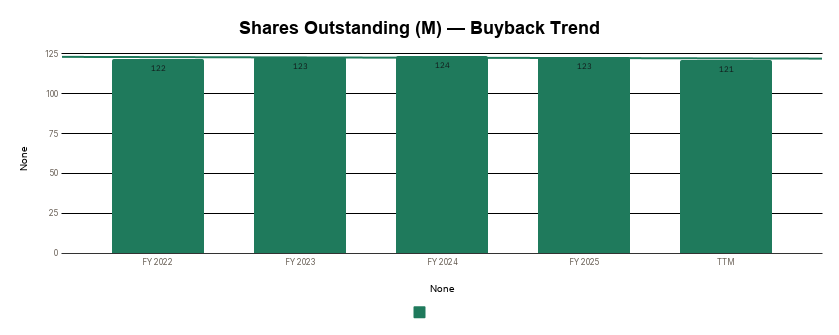
| Buybacks (Share Count Δ) | -0.2% |
| Avg. Distribution Yield | 2.6% |
What the Numbers Show
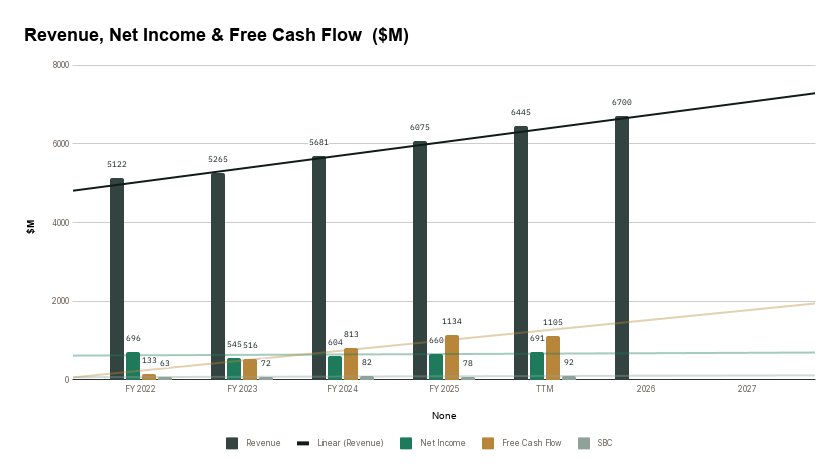
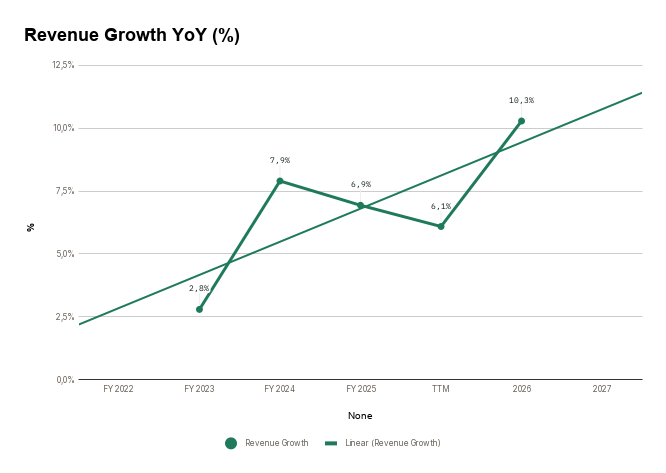
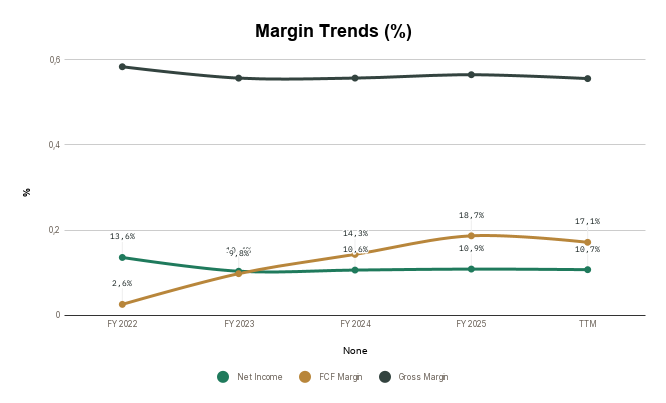
Equifax exhibits strong pricing power and structural profitability with a 55.5% gross margin and an 18.5% operating margin, though net margin narrows to 10.7% due to interest expenses and taxes. Five-year revenue growth of 5.9% demonstrates baseline durability through macro cycles, while the current ROIC of 8.9% shows stable capital efficiency slightly above its 5-year average of 8.4%. The primary financial risk is leverage, with $3.89 billion in net debt requiring 5.6 years to pay down, though a solid 6.7% FCF yield provides sufficient cash cover. Notably, the steep step-down from a trailing P/E of 24.6x to a forward P/E of 13.8x reflects expected earnings expansion as cloud migration costs taper and verification volumes recover.
5-Year Trend — Charts
Revenue, Net Income & Free Cash Flow ($M)
Revenue Growth YoY (%)
Margin Trends (%)
Return on Invested Capital (%)

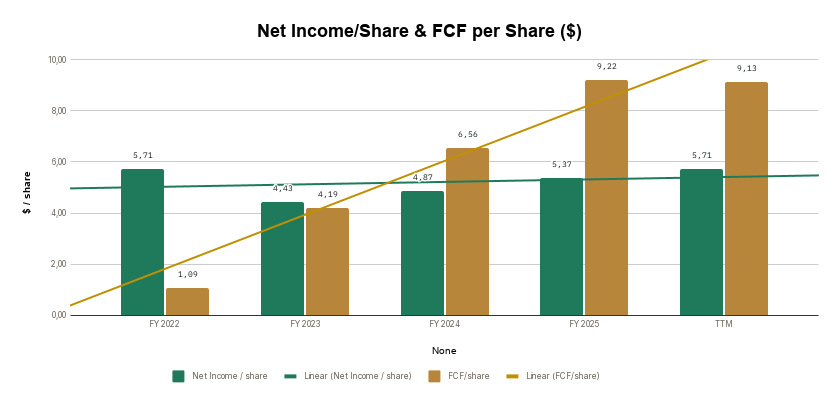
Net Income/Share & FCF per Share ($)
Shares Outstanding (M) — Buyback Trend
04 — Quality Scorecard
| CRITERION | VALUE / ASSESSMENT | PASS |
| Revenue Growth | 5,9% | ✔ |
| Market Potential / Industry Growth | 17,04% | ✔ |
| Quality of Revenues | Recurring | High |
| Product / Process Development | Yes | Better |
| Research & Development | — | Average |
| High Gross Margins | 56,3% | ✔ |
| Profit Margins | 17,0% | ✔ |
| Maintaining Profit Margins | Yes | ✔ |
| Margins vs. Competition | — | Better |
| Pricing Power | Yes | ✔ |
| Debt Structure | 5,62 | Average |
| Rates of Return (ROIC / ROE) | 8,5% | ✔ |
| Management Depth | — | Very competent |
| Culture, Reputation & Labor Relations | — | Good |
| MOAT / Competitive Advantage | Switching Costs | Wide / Formidable |
| MOAT Trend | — | Widening |
| FCF / Share Growth | 95,4% | ✔ |
| Returns Capital (Dividends/Buybacks) | 2,6% | ✔ |
| QUALITY SCORE | — | 83.2 / 100 |
Scale: 80-100 Exceptional · 60-79 Strong · 40-59 Mixed · Below 40 Weak.
What’s Driving the Score
The score is anchored by strong marks on Rates of Return (ROIC / ROE) (10%), Pricing Power (8%), and FCF / Share Growth (8%) — three of its most heavily weighted criteria. Together, the criteria with a clear pass or fail account for roughly 45% of the total weighting — the rest sit at a middling score rather than a firm strength or weakness.
05 — Valuation
Key Assumptions
| Country | United States |
| Business Risk | Safe |
| Discount Rate | 10.33% |
| Revenue Growth — Base | 10.0% |
| Revenue Growth — Bull | 12.0% |
| Revenue Growth — Bear | 8.0% |
| FCF Margin (2032E) | 17.0% |
| Exit P/E Multiple (Base) | 21.0x |
Scenario Analysis
| CASE | PROB. | REV. GROWTH | EXIT P/E | INTRINSIC VALUE |
| Base Case | 60% | 10.0% | 21.0x | $219.13 |
| Bull Case | 20% | 12.0% | 23.0x | $284.90 |
| Bear Case | 20% | 8.0% | 19.0x | $166.49 |
Probability-Weighted Fair Value
| FAIR VALUE $221.76 |
NET CASH / SHARE $-33.08 |
MARGIN OF SAFETY 36.9% |
EXPECTED ANN. RETURN 18.9% |
What This Means
The calculated Fair Value of $221.76 against the current price of $140.00 offers a significant 36.9% margin of safety and a projected 18.9% annual return. Importantly, even the conservative Bear scenario fair value of $166.49 sits comfortably above current trading levels, suggesting downside risks are largely priced in.
Sensitivity Analysis
Intrinsic Value ($ / share) — Discount Rate × Exit P/E
| DISC. RATE ↓ / EXIT P/E → | 17x | 21x | 25x |
| 9.3% | 187.35 | 231.44 | 275.52 |
| 10.3% | 177.39 | 219.13 | 260.87 |
| 11.3% | 168.05 | 207.59 | 247.13 |
Intrinsic Value ($ / share) — Revenue CAGR × FCF Margin
| REV. CAGR ↓ / FCF MARGIN → | 15.0% | 17.0% | 19.0% |
| 9.0% | 180.56 | 206.65 | 232.73 |
| 10.0% | 191.58 | 219.13 | 246.69 |
| 11.0% | 203.11 | 232.20 | 261.29 |
Revenue CAGR ± 1 pt and 2032 FCF margin ± 2 pts around the Base Case; discount rate and exit P/E held at Base Case.
06 — My Take
Overall Conclusion
Equifax is an exceptional business franchise with a Quality Score of 83.2/100, driven by its non-replicable data assets and oligopolistic positioning. The valuation metrics yield a Good Buy signal, backed by a wide 36.9% Margin of Safety at the current $140.00 share price. The principal risk to this investment thesis remains sustained cyclical depression in US residential mortgage originations. However, with a modest forward P/E of 13.8x and a 6.7% FCF yield, the stock offers an unusually favorable entry point for disciplined value investors.
Investment Thesis Check
☑ Is it cheap? (Margin of safety at current price)
☑ Is it a good business? (Quality Score reflects durable fundamentals)
☑ Who is running it? (Management track record checked)
What did I miss? (Deliberately looked for the counter-argument)
3 Sources of Returns
☑ Revenue / Earnings Growth
☑ P/E Expansion
☑ Buybacks and Dividends
| VERDICT GOOD BUY |
Entry Execution & Support Levels
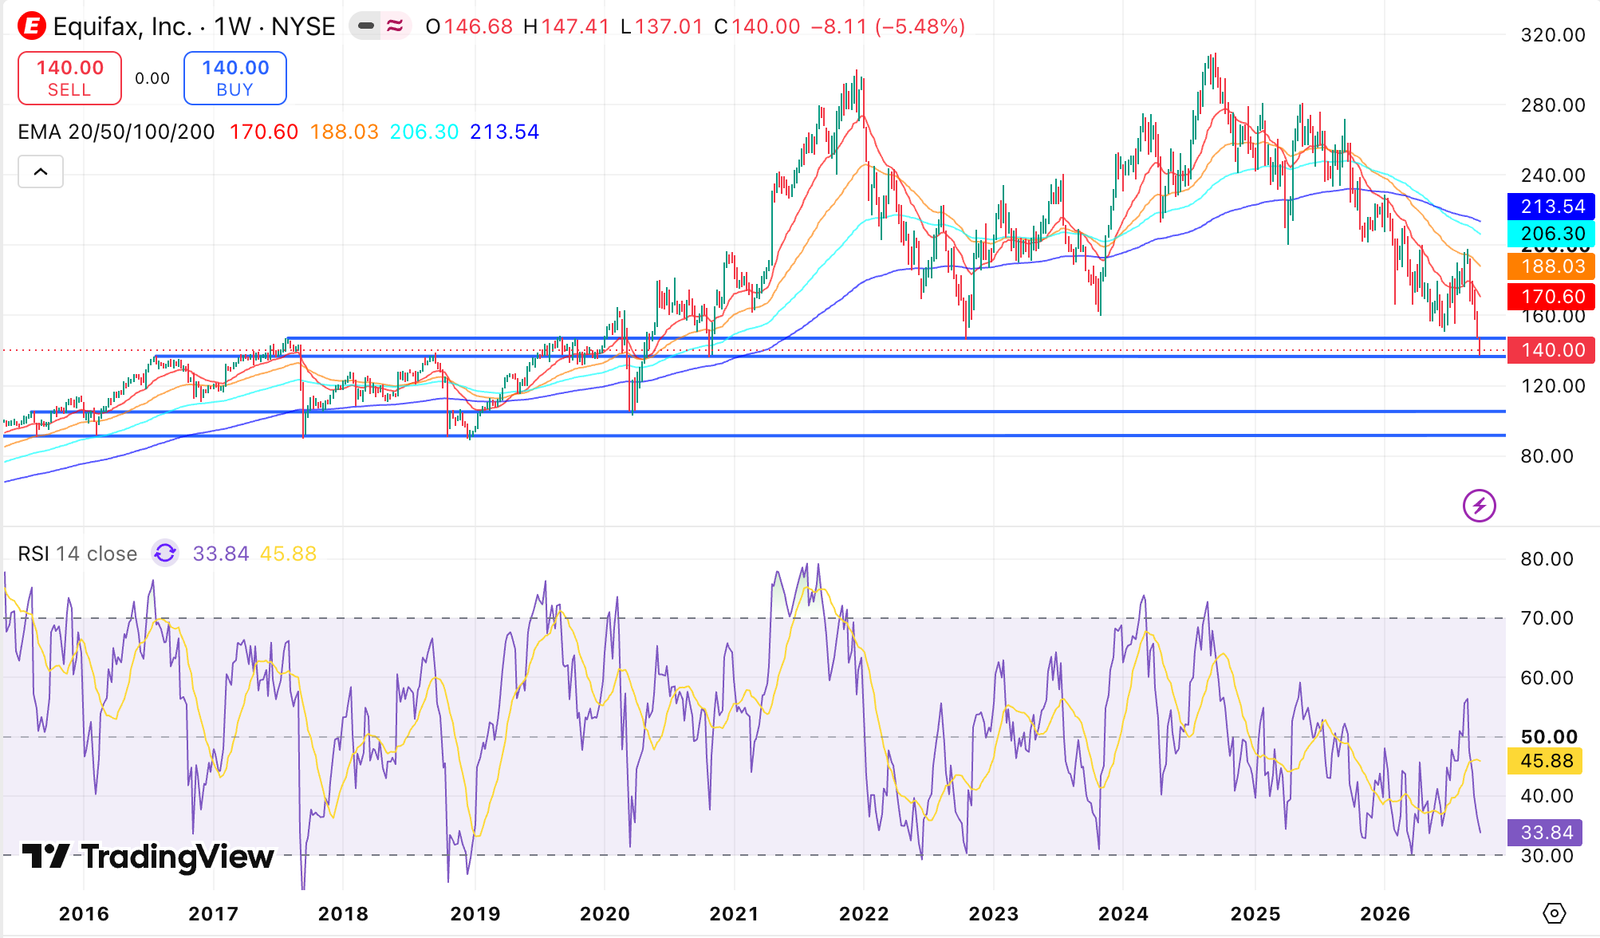
On a weekly timeframe, we had some support levels around 148$ and 137$. For now, the stock is holding the 137$ level. Next possible support is 105$, which is almost 30% down from today´s price.
On the RSI, we are almost at oversold levels.
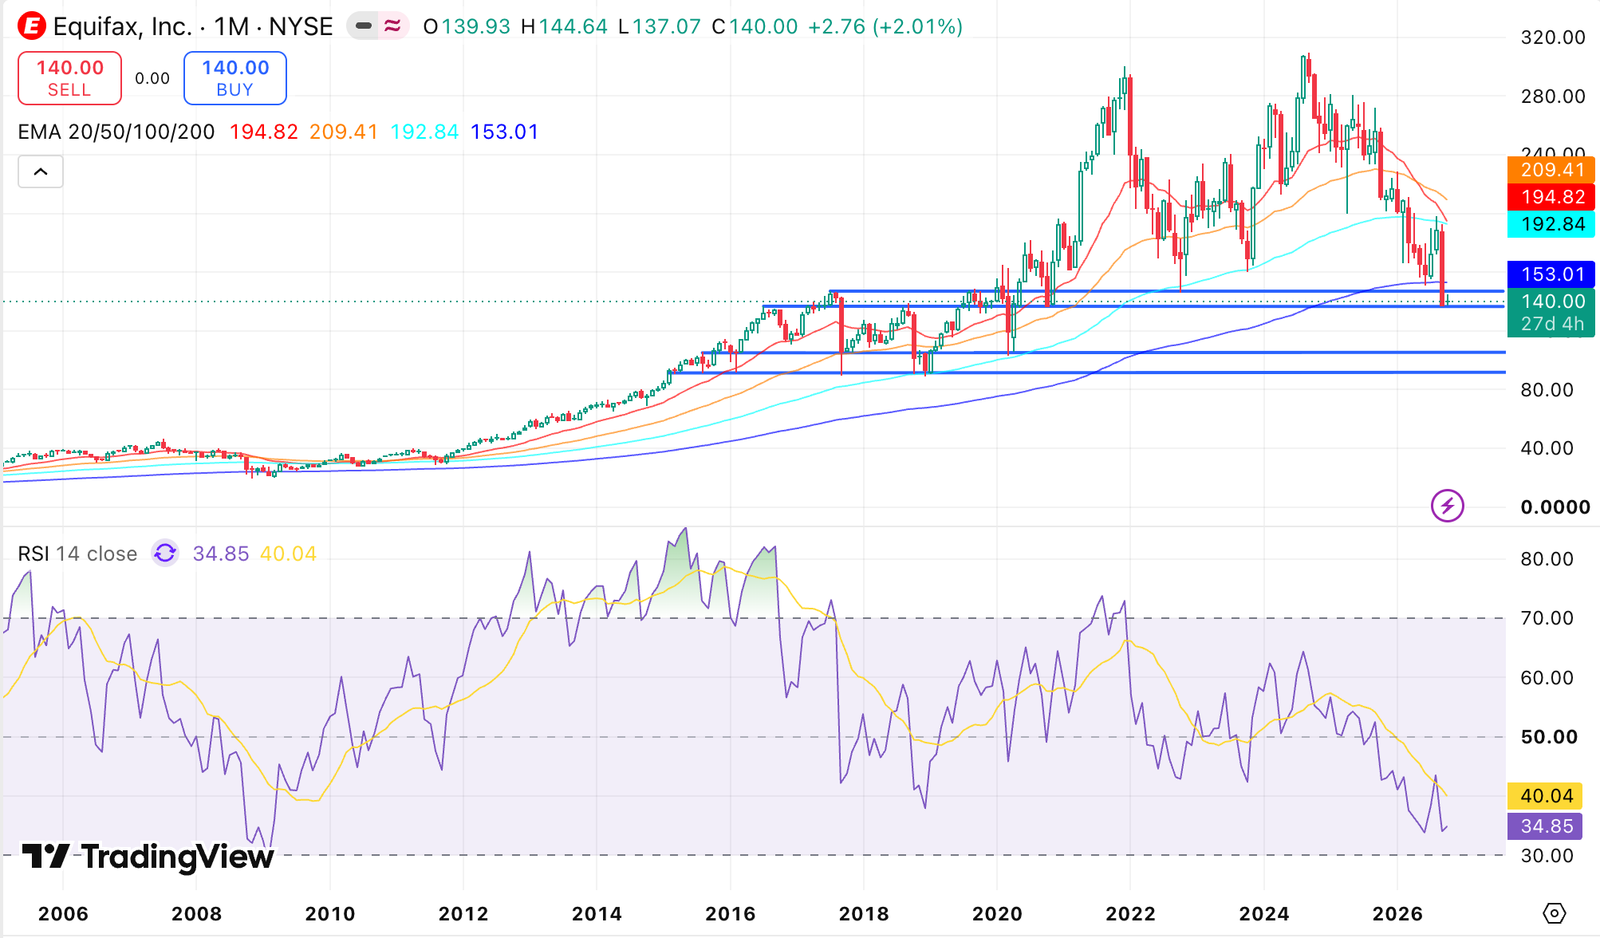

On a monthly timeframe, EFX stock lost its 200EMA, the last time that happened was during the Great Financial Crisis (GFC) when financial stocks overall were on a dumpster fire.
At the moment, sentiment is very negative on Equifax, yields are above 5% and this is a problem for the housing market. But it´s when the sentiment is more negative, that we can find the best opportunities.
Personal Take
Equifax is an incredible company, with great fundamentals in a good trend (revenue growth accelerating and margins increasing). High yields are a problem, and the reason why the sentiment is so negative in the sector (major opportunity?).
Valuation shows a big margin of safety for long term investors, adding that to the quality of the business, makes EFX stock a very attractive investment.
Personally, Equifax is a good position for our MoneyJourney stock, after we doubled our position at 136$ last week. Based on the risk/reward, I would like to grow our EFX position up to 4%( right now, it´s 2,9%), let´s see if we will continue to have this opportunity in the next months.