
MONEYJOURNEY RESEARCH
Loar Holdings Inc (LOAR)

QUALITY VALUE INVESTING RESEARCH
| SECTOR Industrials — Aerospace & Defense |
PRICE AT ANALYSIS $62.21 |
MARKET CAP $5.83B |
DATE October 18, 2026 |
| FAIR VALUE $43.59 |
MARGIN OF SAFETY -42.7% |
QUALITY SCORE 85.2 / 100 |
SIGNAL Hold |
| TL;DR — EXECUTIVE SUMMARY Verdict — Hold — shares trade at $62.21 against a probability-weighted fair value of $43.59, a margin of safety of -42.7% and an expected annual return of 4.8%. Business quality — High-quality aerospace component maker with an 85.2 quality score, generating 53.4% gross margins through high-margin proprietary aftermarket components and disciplined pricing power. Key risk — Elevated debt burden and an 87.6x P/E leave no room for error; given the Hold signal and negative margin of safety, wait for a lower entry price. |
01 — MoneyJourney Introduction
This report follows the MoneyJourney quality value investing framework: understand the business first, assess its quality and durability, calculate a reasoned estimate of intrinsic value, and only act with a margin of safety. The goal is a repeatable, transparent process — not a prediction.
Value-oriented investors may take interest in Loar Holdings due to its business model focused on proprietary, flight-critical aerospace components with strong aftermarket exposure and disciplined operational margins.
02 — The Business
What They Do & How They Make Money
Loar Holdings is a specialized manufacturer and supplier of highly engineered, proprietary aerospace and defense components. The company was built around an acquisition and growth strategy focused on acquiring niche businesses with intellectual property barriers and single-source positioning on key platforms. Its product portfolio includes specialized seatbelts, thermal and acoustic insulation, fluid control valves, actuators, and sensor systems. Loar serves three core end-markets: commercial aerospace, business and general aviation, and defense. A central driver of the business model is securing proprietary designs specified into long-cycle aircraft programs, which subsequently generate decades of high-margin aftermarket spare parts sales. Its customer base includes major aircraft original equipment manufacturers (OEMs), Tier 1 aerospace suppliers, and global defense entities. Geographically, the business is primarily rooted in North America, with expanding delivery channels into international markets. Operating as a consolidated platform, Loar enables its acquired subsidiaries to retain operational focus while benefiting from central capital allocation, purchasing power, and pricing discipline.
Competitive Landscape
Loar competes in the highly fragmented aerospace component sector alongside disciplined acquirers such as TransDigm Group, as well as specialized suppliers like HEICO Corporation and TriMas Corporation. Compared to TransDigm, Loar operates at a much smaller absolute scale but replicates a similar playbook of owning proprietary, sole-source aftermarket parts with strong pricing power. Against HEICO, Loar focuses more heavily on original proprietary OEM-designed hardware rather than PMA alternative replacement parts. Relative to broader industrial suppliers like TriMas and Ducommun, Loar achieves significantly higher gross margins (53.4%) by concentrating exclusively on niche, flight-critical applications. Overall, Loar’s competitive position is holding steady to strengthen as it expands its platform scale and absorbs lingering OEM ramp-up demand.
PEER COMPARISON
| COMPANY | OPERATING MARGIN | ROIC |
| Loar Holdings Inc (LOAR) | 24.7% | 6.5% |
| TransDigm Group Incorporated (TDG) | 45.2% | 18.5% |
| HEICO Corporation (HEI) | 21.0% | 10.5% |
| TriMas Corporation (TRS) | 10.8% | 6.2% |
| Ducommun Incorporated (DCO) | 7.5% | 4.8% |
Revenue Breakdown
BY SEGMENT
Commercial Aerospace generates roughly 45% to 50% of total sales, Defense accounts for approximately 30% to 35%, and Business Aviation contributes the remaining roughly 15% to 20%.
BY GEOGRAPHY
North America represents approximately 80% to 85% of total revenue, with international regions making up the remaining roughly 15% to 20%.
Competitive Advantages & Moat
- Brand Strength — Limited
- Network Effects — Limited
- Switching Costs — High switching costs exist because flight-critical components are engineered into long-life OEM platforms and require rigorous re-certification to replace.
- Cost Advantages / Scale — Limited
- Regulatory / IP Protection — Regulatory FAA certifications and strict aerospace safety standards create significant barriers against competitors attempting to swap out proprietary parts.
Risk Factors
- Heavy debt load of $820 million net debt reduces financial flexibility and exposes the company to elevated interest expense risks.
- A highly demanding valuation multiple of 87.6x trailing earnings leaves the stock vulnerable to steep derating if growth decelerates.
- Supply chain disruptions or rate cuts by major aircraft OEMs could slow aftermarket component utilization and original equipment shipments.
Bull Case
Loar successfully executes its roll-up strategy in high-margin aerospace components while expanding aftermarket cross-selling opportunities. Acceleration in OEM build rates and strong global defense spending drive double-digit organic growth, enabling rapid net debt reduction. Continued operational integration expands operating margins toward upper-tier aerospace peer levels.
Bear Case
Aerospace supply chain bottlenecks or commercial fleet groundings reduce flight hours and component demand, hitting high-margin aftermarket sales. High debt service costs absorb free cash flow, hindering future acquisition activity and slowing earnings growth. Market valuation compresses aggressively from 87.6x P/E toward industry average multiples, causing severe capital loss for recent buyers.
03 — Fundamentals
Valuation Multiples
| Market Cap ($B) | 5.83 |
| Enterprise Value ($B) | 6.67 |
| EV / EBITDA | 31.9x |
| P/E | 87.6x |
| Forward P/E | 38.5x |
| Forward Earnings Yield | 2.6% |
| P/FCF | 63.1x |
| FCF Yield | 1.6% |
Margins & Growth
| Revenue Growth (5Y) | 25.2% |
| Sales Growth YoY | 18.1% |
| Gross Margin | 53.4% |
| Operating Margin | 24.7% |
| Net Margin | 11.6% |
Balance Sheet & Returns
| Cash ($M) | 122 |
| Long-Term Debt ($M) | 943 |
| Net Cash ($M) | -820 |
| Years to Pay Debt | 12.1 |
| ROE | 5.8% |
| ROIC | 6.5% |
| 5-Yr Avg ROIC | 2.0% |
Capital Returns
| Dividend Yield | —% |
| Payout Ratio | 0.00% |
| Buybacks (Share Count Δ) | 2.8% |
| Avg. Distribution Yield | -1.5% |
What the Numbers Show
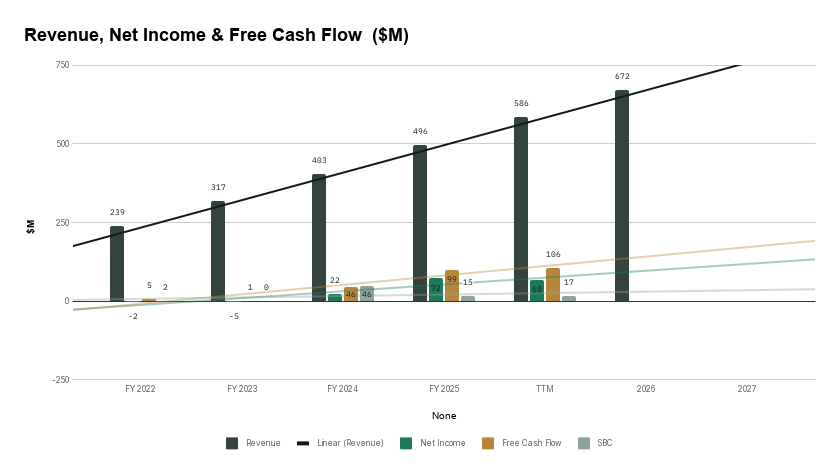
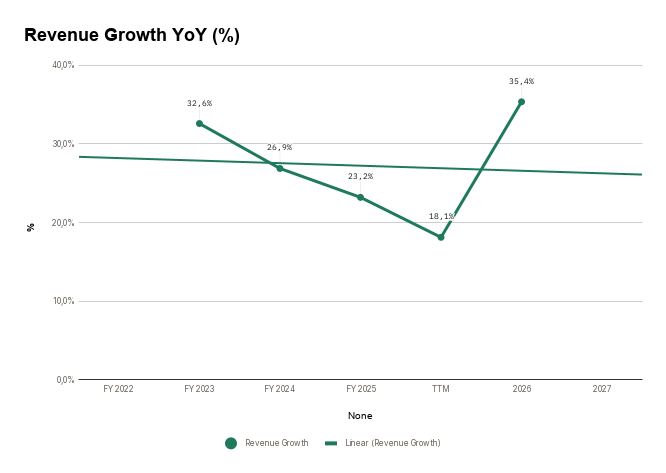
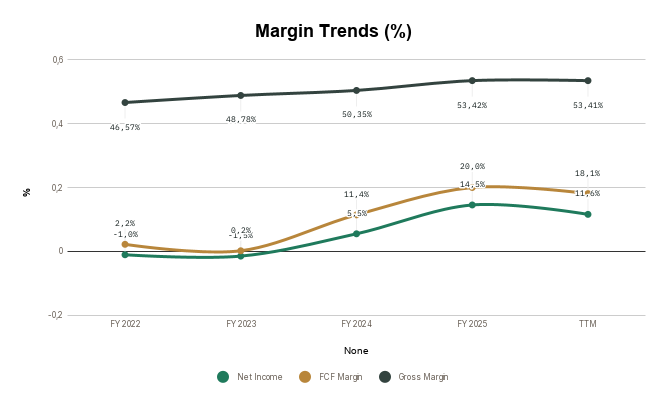
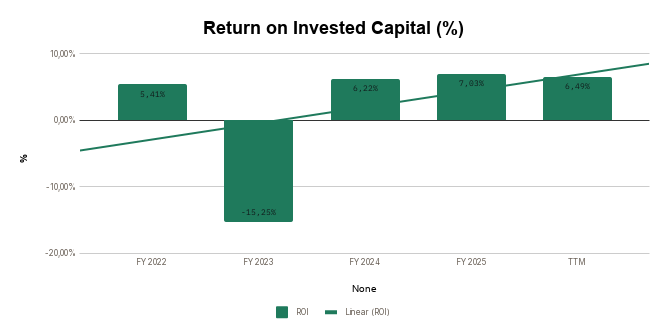
Loar exhibits elite operational profitability, highlighted by a 53.4% gross margin and a 24.7% operating margin that underscore the pricing power of its proprietary product suite. Revenue growth is energetic at 18.1% YoY and a 25.2% 5-year CAGR, driven by a combination of organic aerospace demand recovery and bolt-on acquisitions. However, returns on capital present a more nuanced picture; while ROIC of 6.5% has improved significantly over its 5-year average of 2.0%, both ROIC and ROE (5.8%) remain muted due to a large balance-sheet asset base laden with acquisition goodwill and intangibles. Furthermore, the balance sheet carries considerable leverage with $820 million in net debt, representing 12.1 years of current net income to pay down, which limits financial flexibility.
5-Year Trend — Charts
Revenue, Net Income & Free Cash Flow ($M)
Revenue Growth YoY (%)
Margin Trends (%)
Return on Invested Capital (%)
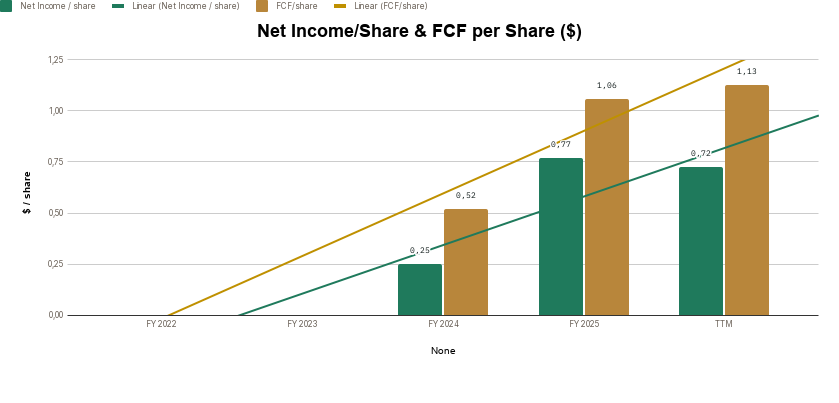
Net Income/Share & FCF per Share ($)
Shares Outstanding (M) — Buyback Trend

04 — Quality Scorecard
MoneyJourney’s 18-criteria weighted checklist — Score and Notes auto-filled from the Stock Analyzer tab.
| CRITERION | VALUE / ASSESSMENT | PASS |
| Revenue Growth | 25,2% | ✔ |
| Market Potential / Industry Growth | 22,29% | ✔ |
| Quality of Revenues | Recurring | High |
| Product / Process Development | Yes | Better |
| Research & Development | — | Average |
| High Gross Margins | 50,5% | ✔ |
| Profit Margins | 10,4% | ✔ |
| Maintaining Profit Margins | Yes | ✔ |
| Margins vs. Competition | — | Better |
| Pricing Power | Yes | ✔ |
| Debt Structure | 12,06 | Average |
| Rates of Return (ROIC / ROE) | 2,0% | メ |
| Management Depth | — | Extraordinary |
| Culture, Reputation & Labor Relations | — | Good |
| MOAT / Competitive Advantage | Proprietary Technology | Wide / Formidable |
| MOAT Trend | — | Widening |
| FCF / Share Growth | 55,3% | ✔ |
| Returns Capital (Dividends/Buybacks) | -1,5% | メ |
| QUALITY SCORE | — | 85.2 / 100 |
Scale: 80-100 Exceptional · 60-79 Strong · 40-59 Mixed · Below 40 Weak.
What’s Driving the Score
The score is anchored by strong marks on Pricing Power (8%), FCF / Share Growth (8%), and Returns Capital (Dividends/Buybacks) (4%) — three of its most heavily weighted criteria. Rates of Return (ROIC / ROE) (10%) is the one clear weak spot pulling the score down. Together, the criteria with a clear pass or fail account for roughly 45% of the total weighting — the rest sit at a middling score rather than a firm strength or weakness.
05 — Valuation
Key Assumptions
| Country | United States |
| Business Risk | Low |
| Discount Rate | 10.92% |
| Revenue Growth — Base | 20.0% |
| Revenue Growth — Bull | 22.0% |
| Revenue Growth — Bear | 16.0% |
| FCF Margin (2032E) | 20.0% |
| Exit P/E Multiple (Base) | 23.0x |
Scenario Analysis
| CASE | PROB. | REV. GROWTH | EXIT P/E | INTRINSIC VALUE |
| Base Case | 60% | 20.0% | 23.0x | $44.33 |
| Bull Case | 20% | 22.0% | 25.0x | $55.39 |
| Bear Case | 20% | 16.0% | 20.0x | $29.56 |
Probability-Weighted Fair Value
| FAIR VALUE $43.59 |
NET CASH / SHARE $-8.75 |
MARGIN OF SAFETY -42.7% |
EXPECTED ANN. RETURN 4.8% |
What This Means
At $62.21, Loar trades well above its Base Fair Value estimate of $44.33 and even exceeds the Bull Case scenario of $55.39, resulting in a -42.7% margin of safety. This pricing leaves prospective investors with an uncompelling expected annual return of 4.8%, implying that market pricing already reflects highly optimistic growth expectations.
Sensitivity Analysis
Intrinsic Value ($ / share) — Discount Rate × Exit P/E
| DISC. RATE ↓ / EXIT P/E → | 19x | 23x | 27x |
| 9.9% | 38.67 | 46.81 | 54.95 |
| 10.9% | 36.62 | 44.33 | 52.04 |
| 11.9% | 34.70 | 42.01 | 49.31 |
Intrinsic Value ($ / share) — Revenue CAGR × FCF Margin
| REV. CAGR ↓ / FCF MARGIN → | 18.0% | 20.0% | 22.0% |
| 19.0% | 37.36 | 41.96 | 46.56 |
| 20.0% | 39.50 | 44.33 | 49.17 |
| 21.0% | 41.72 | 46.80 | 51.89 |
06 — My Take
Overall Conclusion
Loar is an exceptional operational business, as reflected in its Quality Score of 85.2/100, characterized by robust 53.4% gross margins and high-barrier proprietary components. However, the market price severely overvalues these operational merits, resulting in a Hold signal and a negative margin of safety of -42.7%. The stock’s current P/E of 87.6x demands flawless execution, leaving no room for operational stumbles. The single biggest threat to the thesis is the combination of an $820 million net debt load and elevated valuation multiples, exposing the stock to severe multiple compression if growth slows. The bottom line for disciplined quality value investors is to acknowledge the strength of the asset but wait for a substantially better entry valuation before deploying capital.
Investment Thesis Check
☒ Is it cheap? (Margin of safety at current price)
☑ Is it a good business? (Quality Score reflects durable fundamentals)
☑ Who is running it? (Management track record checked)
What did I miss? (Deliberately looked for the counter-argument)
3 Sources of Returns
☑ Revenue / Earnings Growth
☒ P/E Expansion
☑ Buybacks and Dividends
| VERDICT HOLD |