
MONEYJOURNEY RESEARCH
Heico Corp (HEI)
QUALITY VALUE INVESTING RESEARCH
| SECTOR Industrials — Aerospace & Defense |
PRICE AT ANALYSIS $310.82 |
MARKET CAP $37.12B |
DATE October 28, 2026 |
| FAIR VALUE $216.51 |
MARGIN OF SAFETY -43.6% |
QUALITY SCORE 89.4 / 100 |
SIGNAL Hold |
| TL;DR — EXECUTIVE SUMMARY Verdict — Hold — shares trade at $310.82 against a probability-weighted fair value of $216.51, a margin of safety of -43.6% and an expected annual return of 3.4%. Business quality — Exceptional aerospace compounder (Quality Score 89.4) delivering 23.8% operating margins through high-margin aftermarket FAA replacement parts and specialized defense electronics. Key risk — Trading at 51.7x P/E with a -43.6% margin of safety, long-term investors should hold current positions and wait for a significant pullback. |
01 — MoneyJourney Introduction
This report follows the MoneyJourney quality value investing framework: understand the business first, assess its quality and durability, calculate a reasoned estimate of intrinsic value, and only act with a margin of safety. The goal is a repeatable, transparent process — not a prediction.
A quality value investor would study HEICO Corporation as a premier example of a durable aerospace compounder with high capital efficiency and secular aftermarket growth. While the premium valuation demands rigorous analysis, the business model’s persistent cash flow generation and defensive niche positioning warrant continuous tracking for attractive entry points.
02 — The Business
What They Do & How They Make Money
HEICO Corporation is a premier designer and manufacturer of jet engine and aircraft component replacement parts, defense equipment, and specialized electronic components. Founded in 1957 and revitalized under the Mendelson family’s leadership since 1990, the company has scaled into a vital supplier across commercial aviation, defense, space, and industrial markets. Operating through two main business segments, HEICO delivers mission-critical hardware and sub-systems globally. The Flight Support Group (FSG) designs and produces FAA-approved jet engine and aircraft component replacement parts (PMA parts), offering airlines substantial cost savings over original equipment manufacturer (OEM) equivalents, as well as specialized repair and overhaul services. The Electronic Technologies Group (ETG) manufactures niche, high-reliability microelectronics, sub-assemblies, and specialized equipment used in military aircraft, defense systems, satellites, and medical devices. Its customer base spans commercial airlines, repair stations, military branches, prime defense contractors, and space agencies worldwide. Geographically, HEICO operates facilities primarily across North America and Europe, serving clients in over 100 countries. Together, these complementary divisions create a balanced aerospace and defense compounder, combining recurring commercial aftermarket cash flow with stable long-cycle military program revenue.
Competitive Landscape
HEICO competes directly against major original equipment manufacturers like GE Aerospace, RTX Corporation, and Safran, as well as specialized aftermarket peer TransDigm Group. While OEMs leverage proprietary designs and tied-in service agreements, HEICO successfully disrupts their pricing power in the commercial aftermarket by delivering FAA-approved parts at substantial discounts. Compared to TransDigm, which relies heavily on proprietary single-source pricing on OEM-licensed components, HEICO’s Flight Support Group focuses on high-volume alternative replacement parts, creating a distinct value proposition for cost-conscious airlines. In the electronic components sector, peers like Curtiss-Wright compete in specialized defense hardware, but HEICO maintains strong market share in specialized sub-niches like flight instrumentation and thermal management. Overall, HEICO’s market position is steadily strengthening as global airline fleets age and operators prioritize lower maintenance expenditures without sacrificing regulatory compliance.
PEER COMPARISON
| COMPANY | OPERATING MARGIN | ROIC |
| Heico Corp (HEI) | 23.8% | 13.1% |
| TransDigm Group Incorporated (TDG) | 47.5% | 18.5% |
| Parker-Hannifin Corporation (PH) | 21.5% | 14.0% |
| Curtiss-Wright Corporation (CW) | 17.5% | 11.5% |
Revenue Breakdown
BY SEGMENT
The Flight Support Group represents roughly 55% to 60% of total revenue, while the Electronic Technologies Group accounts for approximately 40% to 45%.
BY GEOGRAPHY
The United States accounts for approximately 60% to 65% of net sales, with international customers across Europe, Asia-Pacific, and other regions contributing the remaining roughly 35% to 40%.
Competitive Advantages & Moat
- Brand Strength — Limited
- Network Effects — Limited
- Switching Costs — Highly integrated FAA-certified replacement parts and mission-critical electronics create significant switching costs for commercial airlines and defense platforms.
- Cost Advantages / Scale — Scale in niche aftermarket parts allows HEICO to offer FAA-approved PMA parts at substantial discounts relative to OEM prices while maintaining 40%+ gross margins.
- Regulatory / IP Protection — FAA Parts Manufacturer Approval (PMA) and rigorous defense qualifications create severe regulatory barriers to entry for potential competitors.
Risk Factors
- A sharp downturn in global commercial air travel volume would reduce fleet utilization and depress demand for high-margin replacement parts.
- Aggressive counter-strategies from major original equipment manufacturers to restrict third-party FAA-approved replacement parts could compress organic market share gains.
- Higher debt levels following major acquisitions could elevate interest expense and restrict capital allocation flexibility if cash flow conversion slows.
Bull Case
Sustained expansion of FAA replacement part approvals and market share gains from cost-focused airlines will drive strong organic cash flow compounding. Combined with successful integration of bolt-on acquisitions in defense electronics, HEICO can comfortably deliver above-industry earnings growth.
Bear Case
At over 51x trailing earnings and a -43.6% margin of safety, the stock trades well above its bull-case valuation scenario of $287.77. Any operational hiccup, delayed acquisition synergy, or macro slowdown in aerospace build rates could trigger severe valuation multiple contraction.
03 — Fundamentals
Valuation Multiples
| Market Cap ($B) | 37.12 |
| Enterprise Value ($B) | 40.11 |
| EV / EBITDA | 27.7x |
| P/E | 51.7x |
| Forward P/E | 43.3x |
| Forward Earnings Yield | 2.3% |
| P/FCF | 36.0x |
| FCF Yield | 2.8% |
Margins & Growth
| Revenue Growth (5Y) | 24.0% |
| Sales Growth YoY | 15.4% |
| Gross Margin | 40.4% |
| Operating Margin | 23.8% |
| Net Margin | 16.4% |
Balance Sheet & Returns
| Cash ($M) | 241 |
| Long-Term Debt ($M) | 2522 |
| Net Cash ($M) | -2281 |
| Years to Pay Debt | 2.7 |
| ROE | 18.6% |
| ROIC | 13.1% |
| 5-Yr Avg ROIC | 12.3% |
Capital Returns
| Dividend Yield | 0.08% |
| Payout Ratio | 4.69% |
| Buybacks (Share Count Δ) | 0.5% |
| Avg. Distribution Yield | 0.0% |
What the Numbers Show
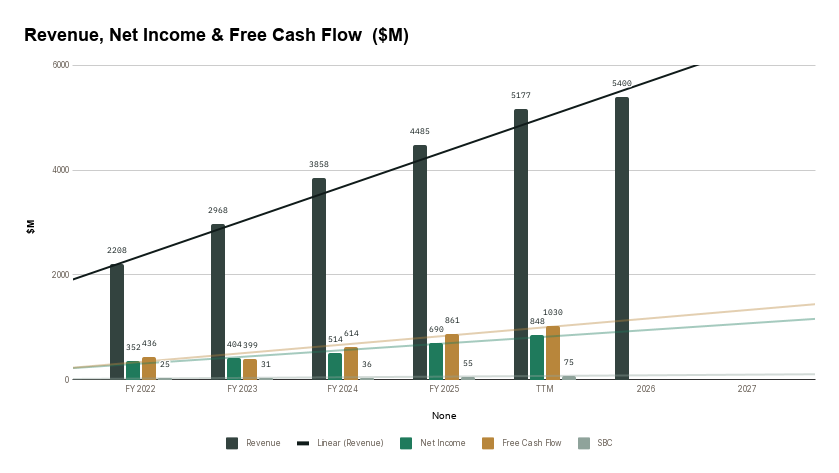
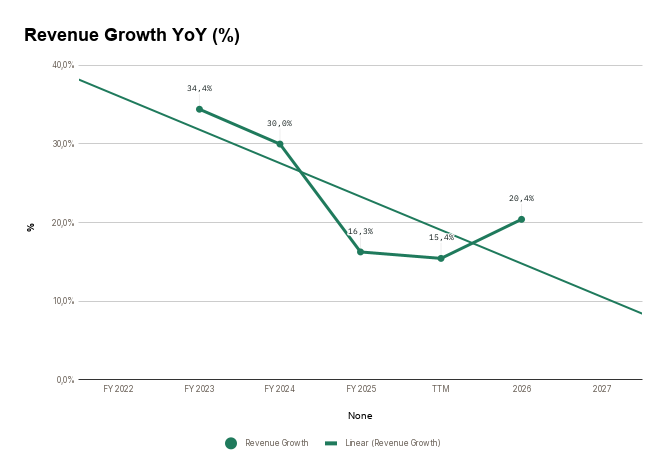
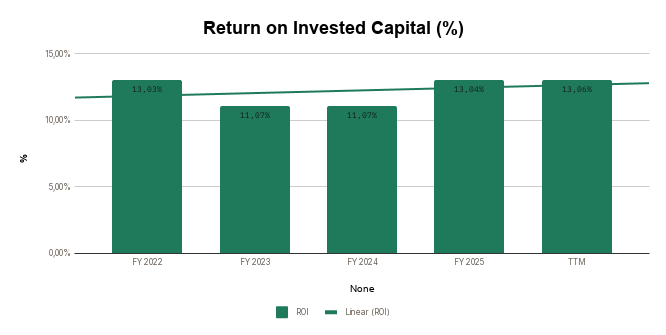
HEICO demonstrates exceptional top-line momentum with a 24.0% 5-year revenue CAGR and 15.4% YoY sales growth, reflecting both steady organic recovery in air traffic and acquisition integration. Gross margins of 40.4% and operating margins of 23.8% underscore strong pricing power and disciplined cost controls across its core divisions. Capital productivity remains exceptional, highlighted by an 18.6% ROE and a 13.1% ROIC that exceeds its 5-year historical average of 12.3%. Despite accumulating $2,281 million in net debt to fund inorganic expansion, the company’s leverage remains manageable at 2.7 years of net debt to cash generation.
5-Year Trend — Charts
Revenue, Net Income & Free Cash Flow ($M)
Revenue Growth YoY (%)
Margin Trends (%)

Return on Invested Capital (%)
Net Income/Share & FCF per Share ($)

Shares Outstanding (M) — Buyback Trend

04 — Quality Scorecard
MoneyJourney’s 18-criteria weighted checklist — Score and Notes auto-filled from the Stock Analyzer tab.
| CRITERION | VALUE / ASSESSMENT | PASS |
| Revenue Growth | 24,0% | ✔ |
| Market Potential / Industry Growth | 18,24% | ✔ |
| Quality of Revenues | Recurring | High |
| Product / Process Development | Yes | Better |
| Research & Development | — | Better |
| High Gross Margins | 39,4% | ✔ |
| Profit Margins | 17,6% | ✔ |
| Maintaining Profit Margins | Yes | ✔ |
| Margins vs. Competition | — | Better |
| Pricing Power | Yes | ✔ |
| Debt Structure | 2,69 | Better |
| Rates of Return (ROIC / ROE) | 12,3% | ✔ |
| Management Depth | — | Extraordinary |
| Culture, Reputation & Labor Relations | — | Extraordinary |
| MOAT / Competitive Advantage | Switching Costs | Wide / Formidable |
| MOAT Trend | — | Widening |
| FCF / Share Growth | 25,6% | ✔ |
| Returns Capital (Dividends/Buybacks) | 0,0% | メ |
| QUALITY SCORE | — | 89.4 / 100 |
Scale: 80-100 Exceptional · 60-79 Strong · 40-59 Mixed · Below 40 Weak.
What’s Driving the Score
The score is anchored by strong marks on Rates of Return (ROIC / ROE) (10%), Pricing Power (8%), and FCF / Share Growth (8%) — three of its most heavily weighted criteria. Returns Capital (Dividends/Buybacks) (4%) is the one clear weak spot pulling the score down. Together, the criteria with a clear pass or fail account for roughly 45% of the total weighting — the rest sit at a middling score rather than a firm strength or weakness.
Want to Know the Exact Moment We Pull the Trigger? Join MoneyJourney Pro.
Reading a report is step one—executing with discipline is how you build wealth. Inside MoneyJourney Pro, you don’t have to guess which stocks are in the Buy Zone today or wonder when we are adding to our positions.
Real-time notifications in #portfolio-moves whenever we buy, trim, or sell a stock with our own money.
See every stock we hold, our exact cost basis, portfolio % weights, and which holdings are Actionable Buys Today.
Unlock every 0–100 MJ Quality Score, Fair Value estimate, Margin of Safety %, and technical entry zone.