
MONEYJOURNEY RESEARCH
Nike Inc (NKE)
QUALITY VALUE INVESTING RESEARCH
| SECTOR Consumer Cyclical — Footwear & Accessories |
PRICE AT ANALYSIS $37.13 |
MARKET CAP $55.15B |
DATE October 18, 2026 |
| FAIR VALUE $36.74 |
MARGIN OF SAFETY -1.0% |
QUALITY SCORE 61.2 / 100 |
SIGNAL Hold |
| TL;DR — EXECUTIVE SUMMARY Verdict — Hold — shares trade at $37.13 against a probability-weighted fair value of $36.74, a margin of safety of -1.0% and an expected annual return of 10.4%. Business quality — Nike is a strong global market leader with a 61.2 Quality Score, solid 18.9% ROIC, and net cash balance sheet, despite recent top-line headwinds. Key risk — The primary risk is market share loss in core performance categories; given the Hold signal, long-term investors should wait for a wider margin of safety. |
01 — MoneyJourney Introduction
This report follows the MoneyJourney quality value investing framework: understand the business first, assess its quality and durability, calculate a reasoned estimate of intrinsic value, and only act with a margin of safety. The goal is a repeatable, transparent process — not a prediction.
Value investors may take a fresh look at Nike as significant share price pullbacks bring a dominant global consumer brand near fair value despite temporary operational headwinds. A pristine balance sheet with net cash provides downside protection while management recalibrates product innovation and distribution strategies.
02 — The Business
What They Do & How They Make Money
Nike Inc. is the world’s premier designer, marketer, and distributor of athletic footwear, apparel, equipment, and accessories, operating on a vast global scale built over six decades. The company operates primarily through the namesake Nike Brand alongside the Converse subsidiary. Revenue within the Nike Brand is primarily categorized across Footwear, Apparel, and Equipment, with Footwear generating the lion’s share of overall sales through high-volume running, basketball, and lifestyle product franchises. Nike reaches consumers through a dual-channel distribution framework, balancing wholesale partners such as sporting goods retailers with direct-to-consumer sales executed via company-owned retail stores and digital platforms. Geographically, the business is well-diversified across North America, Europe, Middle East and Africa (EMEA), Greater China, and Asia Pacific & Latin America (APLA). Converse operates as a standalone business unit contributing licensing revenues and sales from iconic casual lifestyle footwear and apparel. Together, these complementary channels and sub-brands form an integrated ecosystem designed to capture global activewear demand across performance and casual lifestyle categories.
Competitive Landscape
Nike maintains the leading global market share in athletic footwear and apparel, but its competitive position is currently facing erosion in specific performance categories. Its primary global competitor, Adidas, competes across all major sports categories with comparable international scale, while specialized performance brands like Hoka (Deckers) and On Running are capturing market share in key running sub-segments through focused product innovation. Premium apparel specialists like Lululemon continue to pressure Nike’s lifestyle and women’s training categories. While Nike retains unmatched scale, marketing resources, and global sponsorship assets, its historic pricing power and innovation lead have softened relative to agile pure-play runners. Overall, Nike’s broader market leadership remains firm, but its position in core technical running categories has eroded, forcing a strategic shift back toward product-led innovation.
PEER COMPARISON
| COMPANY | OPERATING MARGIN | ROIC |
| Nike Inc (NKE) | 8.8% | 18.9% |
| Adidas AG (ADDYY) | 5.2% | 6.8% |
| Puma SE (PUMSY) | 7.2% | 9.5% |
| Deckers Outdoor Corp (DECK) | 21.5% | 32.1% |
| Lululemon Athletica Inc (LULU) | 23.2% | 38.4% |
Revenue Breakdown
BY SEGMENT
Nike Brand Footwear generates roughly 66% of total revenue, with Nike Brand Apparel contributing approximately 28%. Nike Brand Equipment and the Converse subsidiary account for the remaining roughly 6% combined.
BY GEOGRAPHY
North America represents approximately 43% of total revenue, followed by EMEA at roughly 27%, Greater China at approximately 15%, and APLA at roughly 15%.
Competitive Advantages & Moat
- Brand Strength — Unmatched global brand awareness, iconic marketing campaigns, and premier athlete sponsorships drive immense consumer affinity and pricing power.
- Network Effects — Limited
- Switching Costs — Limited
- Cost Advantages / Scale — Massive global supply chain scale and distribution reach provide material unit-cost efficiencies over smaller athletic apparel peers.
- Regulatory / IP Protection — Limited
Risk Factors
- Inability to reignite performance product innovation, causing continued market share losses to aggressive competitors in core running and athletic categories.
- Extended promotional discounting required to clear excess apparel and footwear inventory, further depressing gross and operating margins.
- Persistent macroeconomic consumer weakness and competitive headwinds in Greater China impacting high-margin regional growth.
Bull Case
Nike successfully revitalizes its product pipeline and re-engages wholesale retail partners, driving top-line growth back into positive territory. Margin expansion follows as full-price selling resumes and supply chain scale efficiencies take hold, allowing returns on capital to rebound toward historical averages.
Bear Case
Challenger footwear and apparel brands permanently capture market share in performance categories, diluting Nike’s brand equity and pricing power. Revenue contraction persists while earnings deteriorate further, causing the stock to re-rate down toward the $20.12 Bear scenario.
03 — Fundamentals
Valuation Multiples
| Market Cap ($B) | 55.15 |
| Enterprise Value ($B) | 57.85 |
| EV / EBITDA | 12.1x |
| P/E | 17.8x |
| Forward P/E | 24.8x |
| Forward Earnings Yield | 4.0% |
| P/FCF | 26.2x |
| FCF Yield | 3.8% |
Margins & Growth
| Revenue Growth (5Y) | -2.6% |
| Sales Growth YoY | -1.1% |
| Gross Margin | 43.4% |
| Operating Margin | 8.8% |
| Net Margin | 6.7% |
Balance Sheet & Returns
| Cash ($M) | 8368 |
| Long-Term Debt ($M) | 5946 |
| Net Cash ($M) | 2422 |
| Years to Pay Debt | -0.8 |
| ROE | 21.6% |
| ROIC | 18.9% |
| 5-Yr Avg ROIC | 26.0% |
Capital Returns
| Dividend Yield | 4.26% |
| Payout Ratio | 77.67% |
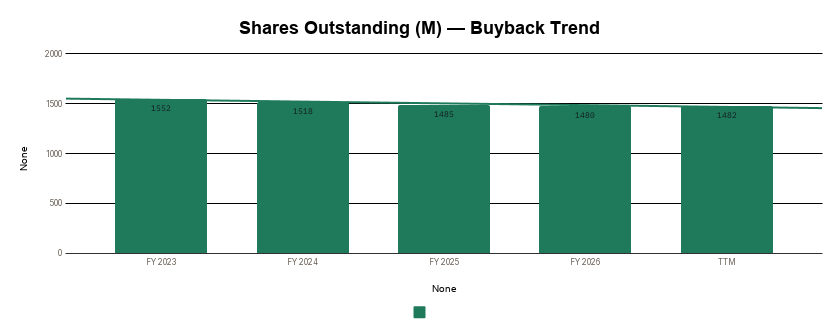
| Buybacks (Share Count Δ) | -1.1% |
| Avg. Distribution Yield | 5.3% |
What the Numbers Show
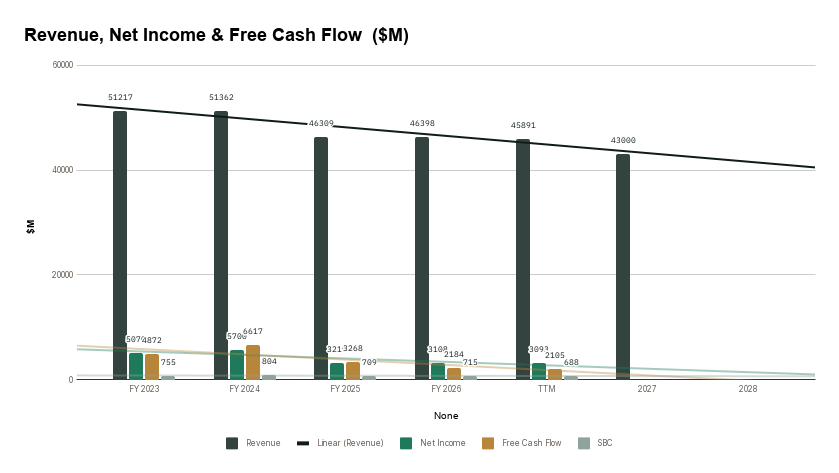
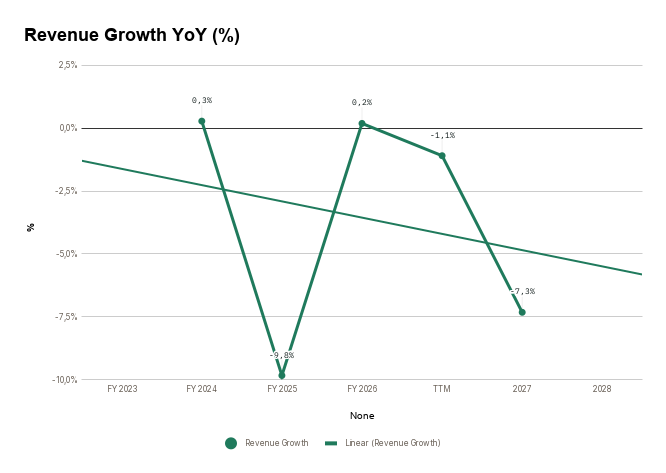
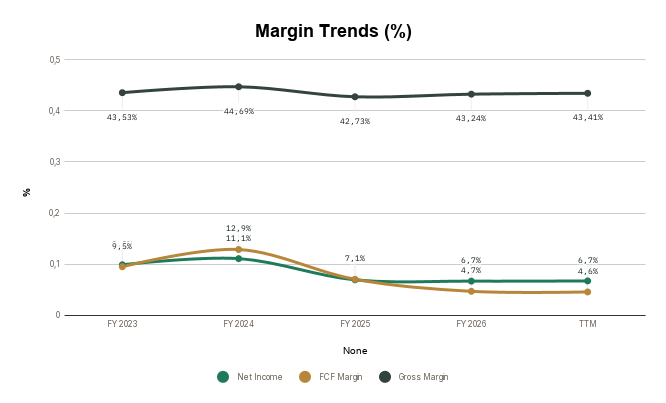
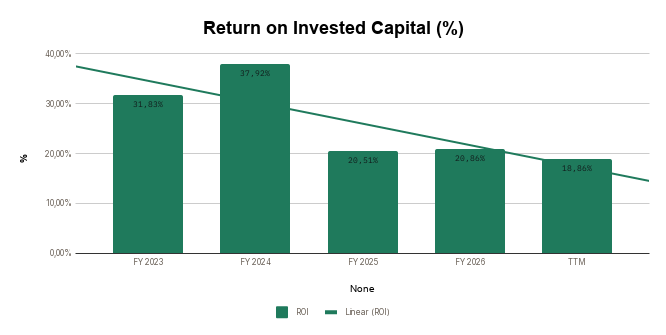
Nike’s fundamentals reflect a high-quality business enduring a temporary operational transition, marked by top-line contraction with revenue declining 2.6% over five years and 1.1% year-over-year. Capital efficiency remains structurally attractive with an 18.9% ROIC and 21.6% ROE, though current returns sit noticeably below the company’s five-year average ROIC of 26.0% due to compressed operating margins of 8.8%. Crucially, the forward P/E of 24.8x is higher than the trailing P/E of 17.8x, signaling that market consensus expects near-term earnings declines before profitability stabilizes. The balance sheet remains a distinct strength, holding $2,422M in net cash and providing complete financial flexibility to fund product development without solvency risk.
5-Year Trend — Charts
Revenue, Net Income & Free Cash Flow ($M)
Revenue Growth YoY (%)
Margin Trends (%)
Return on Invested Capital (%)
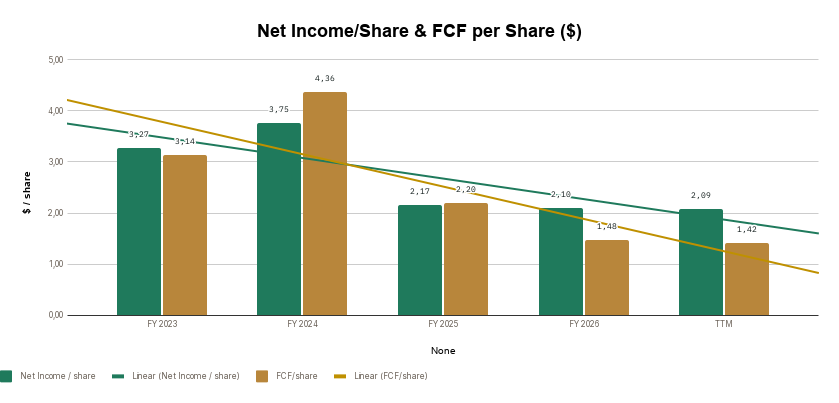
Net Income/Share & FCF per Share ($)
Shares Outstanding (M) — Buyback Trend
04 — Quality Scorecard
| CRITERION | VALUE / ASSESSMENT | PASS |
| Revenue Growth | -2,6% | メ |
| Market Potential / Industry Growth | -4,38% | メ |
| Quality of Revenues | Consumer Based | Medium |
| Product / Process Development | Yes | Average |
| Research & Development | — | Average |
| High Gross Margins | 43,5% | ✔ |
| Profit Margins | 7,7% | ✔ |
| Maintaining Profit Margins | No | メ |
| Margins vs. Competition | — | Average |
| Pricing Power | Yes | ✔ |
| Debt Structure | -0,78 | Better |
| Rates of Return (ROIC / ROE) | 26,0% | ✔ |
| Management Depth | — | Competent |
| Culture, Reputation & Labor Relations | — | Good |
| MOAT / Competitive Advantage | Intangible Assets | Sustainable |
| MOAT Trend | — | Deteriorating |
| FCF / Share Growth | -11,8% | メ |
| Returns Capital (Dividends/Buybacks) | 5,3% | ✔ |
| QUALITY SCORE | — | 61.2 / 100 |
Scale: 80-100 Exceptional · 60-79 Strong · 40-59 Mixed · Below 40 Weak.
What’s Driving the Score
The score is anchored by strong marks on Rates of Return (ROIC / ROE) (10%), Pricing Power (8%), and Returns Capital (Dividends/Buybacks) (4%) — three of its most heavily weighted criteria. On the other side, FCF / Share Growth (8%), Revenue Growth (3%), Market Potential / Industry Growth (3%) and Maintaining Profit Margins (3%) are the clear weak spots pulling the score down. Together, the criteria with a clear pass or fail account for roughly 45% of the total weighting — the rest sit at a middling score rather than a firm strength or weakness.
This article is for paid members
Become a member to read the full analysis, and get the premium content on the site.