
MONEYJOURNEY RESEARCH TEMPLATE
Verisk Analytics, Inc. (VRSK)

QUALITY VALUE INVESTING RESEARCH
| SECTOR Industrials — Consulting Services |
PRICE AT ANALYSIS $177.63 |
MARKET CAP $23.12B |
DATE October 10, 2026 |
| FAIR VALUE $186.40 |
MARGIN OF SAFETY 4.7% |
QUALITY SCORE 92.0 / 100 |
SIGNAL Buy |
| TL;DR — EXECUTIVE SUMMARY Verdict — Buy — shares trade at $177.63 against a probability-weighted fair value of $186.40, a margin of safety of 4.7% and an expected annual return of 11.9%. Business quality — Verisk is an exceptional pure-play insurance analytics enterprise boasting a 92.0 Quality Score, 44.8% operating margins, and a dominant data network effect. Key risk — The key risk is insurance carrier consolidation reducing overall licensing seats; long-term investors should accumulate shares given the current Buy signal. |
01 — MoneyJourney Introduction
This report follows the MoneyJourney quality value investing framework: understand the business first, assess its quality and durability, calculate a reasoned estimate of intrinsic value, and only act with a margin of safety. The goal is a repeatable, transparent process — not a prediction.
Verisk Analytics offers a compelling entry point for quality-focused investors following its transition into a pure-play insurance data and analytics provider. The business trades at a reasonable forward valuation while yielding robust cash flow, backed by near-monopolistic proprietary datasets and embedded workflow solutions across the property and casualty insurance ecosystem.
02 — The Business
What They Do & How They Make Money
Founded in 1971 as Insurance Services Office (ISO), Verisk Analytics has evolved into an essential data analytics and risk assessment provider primarily serving the property and casualty (P&C) insurance market. The company operates through two primary insurance-focused solutions: Underwriting & Rating and Claims. Underwriting & Rating provides actuarial data, proprietary loss costs, standardized policy forms, and risk scoring solutions that enable insurers to price risk accurately and optimize underwriting workflows. The Claims segment supplies tools for fraud detection, catastrophe modeling through its AIR Worldwide unit, and repair cost estimation via Xactimate. Verisk derives revenue predominantly through multi-year subscription agreements and transaction-based fees, creating high recurring revenues with exceptional visibility. Its customer base includes top global P&C insurers, reinsurers, brokers, and managing general agents. Although expanding internationally into markets across Europe and Asia-Pacific, the vast majority of Verisk’s revenue remains rooted in North America. By focusing strictly on insurance data after divesting its non-core energy and financial services divisions, Verisk operates a cohesive enterprise where single data collection efforts support multiple analytical product suites.
Competitive Landscape
Verisk holds an entrenched market position with durable pricing power, maintaining an effective monopoly in U.S. P&C advisory loss costs and policy form standardization. In catastrophe modeling and claims management, it competes primarily against Moody’s (via Moody’s RMS) and specialized niche analytics firms, where Verisk maintains a strong share owing to deep integration with primary insurer workflows. In broad risk and identity analytics, LexisNexis Risk Solutions (a subsidiary of RELX) presents direct competition, yet Verisk differentiates through its proprietary historical loss databases contributed by member insurers. CoreLogic competes in real estate and property risk data, but Verisk’s broader ecosystem coverage gives it a scale advantage in property-level analytics. Overall, Verisk’s competitive position remains firmly holding to strengthening, as regulatory barriers and network effects around its industry-contributed databases make subscriber substitution exceptionally difficult.
PEER COMPARISON
| COMPANY | OPERATING MARGIN | ROIC |
| Verisk Analytics, Inc. (VRSK) | 44.8% | 31.7% |
| RELX PLC (RELX) | 31.8% | 19.5% |
| Moody’s Corporation (MCO) | 41.5% | 21.2% |
| S&P Global Inc. (SPGI) | 46.2% | 12.8% |
| Fair Isaac Corporation (FICO) | 52.1% | 48.6% |
Revenue Breakdown
BY SEGMENT
Underwriting & Rating solutions account for roughly 70% to 75% of total revenue. Claims solutions generate the remaining roughly 25% to 30% of consolidated revenue.
BY GEOGRAPHY
The United States accounts for approximately 80% to 85% of total revenue. International operations make up the remaining roughly 15% to 20%.
Competitive Advantages & Moat
- Brand Strength — Strong institutional reputation and regulatory recognition as the benchmark provider of actuarial data and standardized forms.
- Network Effects — Unmatched data network effects created by decades of industry-contributed insurance claims and loss data from virtually all major U.S. carriers.
- Switching Costs — Deep workflow integration into insurer core software engines makes replacing Verisk’s rate files, forms, and claims platforms prohibitively expensive and risky.
- Cost Advantages / Scale — Massive fixed cost leverage over a vast dataset allows Verisk to generate 45% operating margins that smaller entrants cannot match.
- Regulatory / IP Protection — Designated status as a licensed rating organization in all U.S. states creates immense regulatory barriers to entry.
Risk Factors
- Insurer industry consolidation could reduce the total number of enterprise subscription licenses and aggregate transactional volume.
- A severe pullback in property and casualty premium growth could damp insurer IT spending on discretionary analytical add-ons.
- Cybersecurity breaches involving sensitive policyholder or claims data could damage reputation and trigger regulatory liabilities.
Bull Case
Verisk leverages its non-discretionary data footprint to pass through price increases while continually launching AI-driven underwriting and claims automation tools. Margin expansion accelerates as legacy cost structures are streamlined following the divestiture of non-core segments. Robust free cash flow generation enables continued capital return through aggressive share buybacks alongside disciplined tuck-in M&A.
Bear Case
Sluggish top-line growth persists if property-casualty carriers push back against price increases or slow their adoption of advanced analytics. Increased competition from specialized risk modeling platforms and tech-enabled claims entrants erodes pricing power in supplemental tools. Higher interest rates increase interest expense on the $3.65 billion debt load, constraining future share repurchases.
03 — Fundamentals
Valuation Multiples
| Market Cap ($B) | 23.12 |
| Enterprise Value ($B) | 27.18 |
| EV / EBITDA | 15.7x |
| P/E | 27.3x |
| Forward P/E | 20.4x |
| Forward Earnings Yield | 4.9% |
| P/FCF | 18.7x |
| FCF Yield | 5.3% |
Margins & Growth
| Revenue Growth (5Y) | 5.9% |
| Sales Growth YoY | 2.1% |
| Gross Margin | 70.2% |
| Operating Margin | 44.8% |
| Net Margin | 28.2% |
Balance Sheet & Returns
| Cash ($M) | 552 |
| Long-Term Debt ($M) | 4206 |
| Net Cash ($M) | -3654 |
| Years to Pay Debt | 4.1 |
| ROE | 444.1% |
| ROIC | 31.7% |
| 5-Yr Avg ROIC | 27.5% |
Capital Returns
| Dividend Yield | 1.12% |
| Payout Ratio | 27.76% |
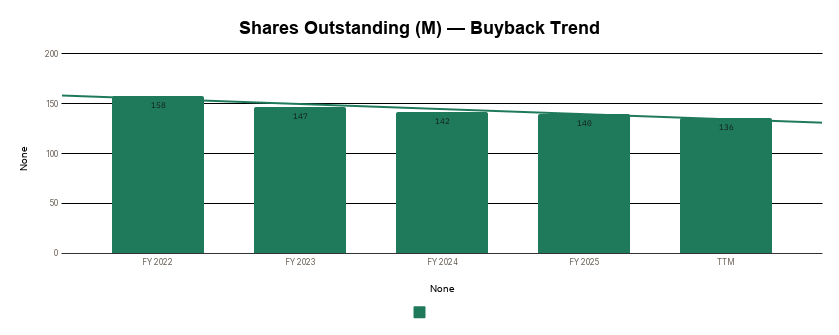
| Buybacks (Share Count Δ) | -3.7% |
| Avg. Distribution Yield | 4.0% |
What the Numbers Show
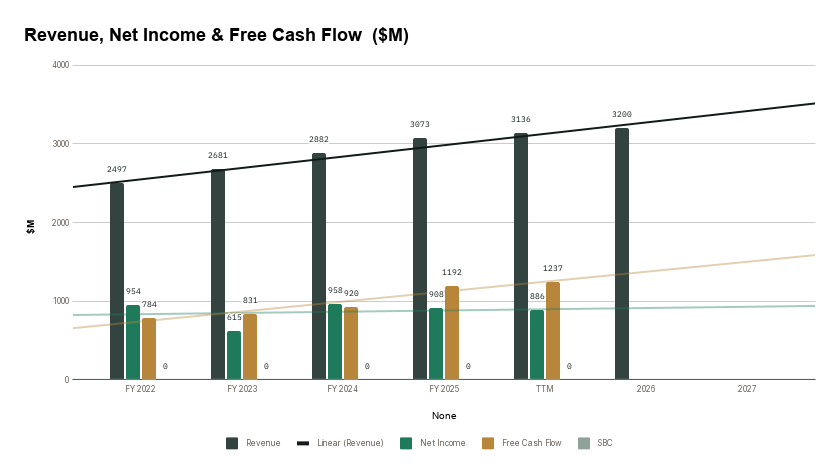
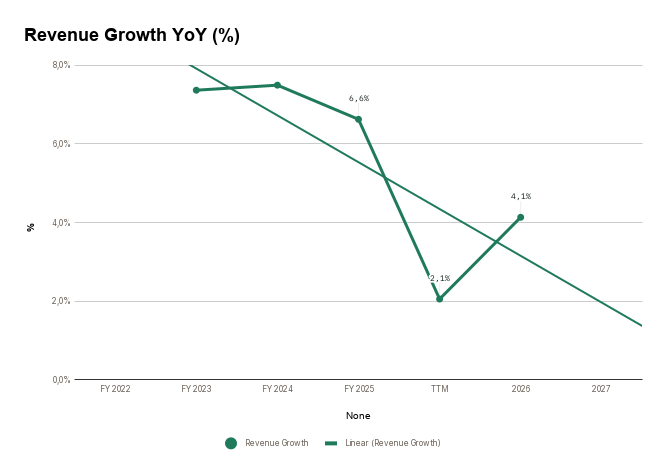
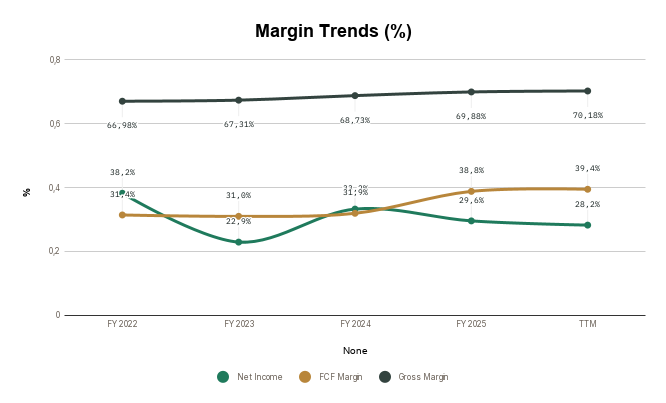
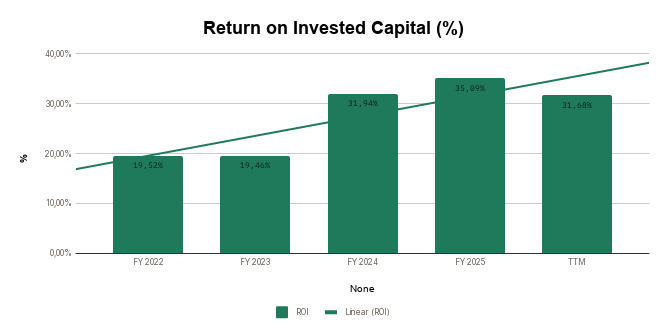
Verisk demonstrates world-class operational efficiency, evidenced by an extraordinary 70.2% gross margin and a 44.8% operating margin. ROIC stands at an impressive 31.7%, comfortably surpassing its 5-year average of 27.5% and illustrating expanding capital productivity following the divestiture of lower-margin assets. While top-line growth appears modest at 2.1% YoY and 5.9% annualized over five years, organic growth remains durable due to price increases and increased cross-selling into core insurance workflows. The extreme ROE of 444.1% is a mathematical artifact of an equity base diminished by sustained share repurchases funded by robust free cash flow. Balance sheet leverage is modest relative to profitability, with a net debt position of $3.65 billion that would require a manageable 4.1 years to repay using operating earnings.
5-Year Trend — Charts
Revenue, Net Income & Free Cash Flow ($M)
Revenue Growth YoY (%)
Margin Trends (%)
Return on Invested Capital (%)
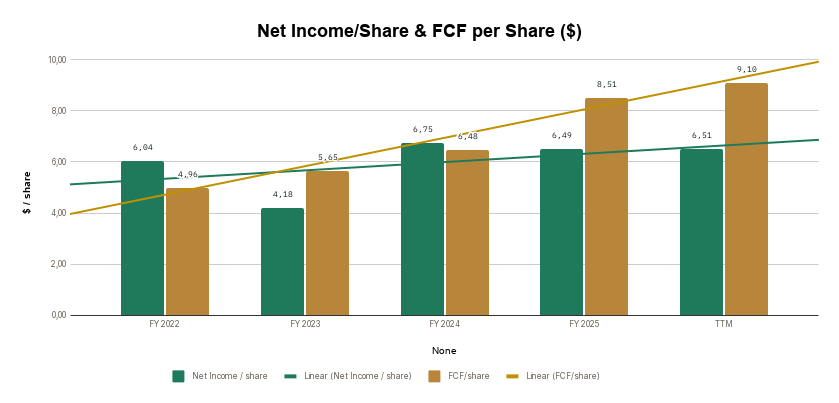
Net Income/Share & FCF per Share ($)
Shares Outstanding (M) — Buyback Trend
04 — Quality Scorecard
| CRITERION | VALUE / ASSESSMENT | PASS |
| Revenue Growth | 5,9% | ✔ |
| Market Potential / Industry Growth | 10,89% | ✔ |
| Quality of Revenues | Recurring | High |
| Product / Process Development | Yes | Better |
| Research & Development | — | Better |
| High Gross Margins | 68,6% | ✔ |
| Profit Margins | 34,5% | ✔ |
| Maintaining Profit Margins | Yes | ✔ |
| Margins vs. Competition | — | Better |
| Pricing Power | Yes | ✔ |
| Debt Structure | 4,13 | Average |
| Rates of Return (ROIC / ROE) | 27,5% | ✔ |
| Management Depth | — | Extraordinary |
| Culture, Reputation & Labor Relations | — | Extraordinary |
| MOAT / Competitive Advantage | Proprietary Technology | Impenetrable / Monopoly |
| MOAT Trend | — | Widening |
| FCF / Share Growth | 16,7% | ✔ |
| Returns Capital (Dividends/Buybacks) | 4,0% | ✔ |
| QUALITY SCORE | — | 92.0 / 100 |
Scale: 80-100 Exceptional · 60-79 Strong · 40-59 Mixed · Below 40 Weak.
What’s Driving the Score
The score is anchored by strong marks on Rates of Return (ROIC / ROE) (10%), Pricing Power (8%), and FCF / Share Growth (8%) — three of its most heavily weighted criteria. Together, the criteria with a clear pass or fail account for roughly 45% of the total weighting — the rest sit at a middling score rather than a firm strength or weakness.
05 — Valuation
Key Assumptions
| Country | United States |
| Business Risk | Low |
| Discount Rate | 11.07% |
| Revenue Growth — Base | 6.0% |
| Revenue Growth — Bull | 8.0% |
| Revenue Growth — Bear | 4.0% |
| FCF Margin (2032E) | 34.0% |
| Exit P/E Multiple (Base) | 23.0x |
Scenario Analysis
| CASE | PROB. | REV. GROWTH | EXIT P/E | INTRINSIC VALUE |
| Base Case | 60% | 6.0% | 23.0x | $185.58 |
| Bull Case | 20% | 8.0% | 25.0x | $221.50 |
| Bear Case | 20% | 4.0% | 21.0x | $153.77 |
Probability-Weighted Fair Value
| FAIR VALUE $186.40 |
NET CASH / SHARE $-28.07 |
MARGIN OF SAFETY 4.7% |
EXPECTED ANN. RETURN 11.9% |
What This Means
At $177.63, the stock trades at a slight discount to its estimated fair value of $186.40, yielding a modest 4.7% margin of safety and a 5.3% FCF yield. With scenario fair values spanning from $153.77 in a bear case to $221.50 in a bull case, the valuation offers an attractive asymmetric risk profile for an exceptional asset.
Sensitivity Analysis
Intrinsic Value ($ / share) — Discount Rate × Exit P/E
| DISC. RATE ↓ / EXIT P/E → | 19x | 23x | 27x |
| 10.1% | 161.85 | 195.92 | 230.00 |
| 11.1% | 153.30 | 185.58 | 217.85 |
| 12.1% | 145.27 | 175.86 | 206.44 |
Intrinsic Value ($ / share) — Revenue CAGR × FCF Margin
| REV. CAGR ↓ / FCF MARGIN → | 32.0% | 34.0% | 36.0% |
| 5.0% | 165.00 | 175.32 | 185.63 |
| 6.0% | 174.66 | 185.58 | 196.49 |
| 7.0% | 184.78 | 196.33 | 207.88 |
06 — My Take
Overall Conclusion
Verisk is a pristine quality business, reflected in its Quality Score of 92.0/100 and world-class operating margins near 45%. The current valuation produces a Buy signal with a 4.7% margin of safety and an expected annual return of 11.9%, driven by an appealing forward P/E of 20.4x and a 5.3% free cash flow yield. The primary operational risk to the thesis is potential consolidation among primary insurance carriers, which could compress subscription customer counts or reduce transaction volume. Nevertheless, the combination of irreplaceable proprietary data assets, price inelastic demand, and capital-light growth offers high long-term certainty. Investors seeking predictable cash flow compounders should view current price levels as an attractive buying opportunity.
Investment Thesis Check
☒ Is it cheap? (Margin of safety at current price)
☑ Is it a good business? (Quality Score reflects durable fundamentals)
☑ Who is running it? (Management track record checked)
What did I miss? (Deliberately looked for the counter-argument)
3 Sources of Returns
☑ Revenue / Earnings Growth
☒ P/E Expansion
☑ Buybacks and Dividends
| VERDICT BUY |
Entry Execution & Support Levels
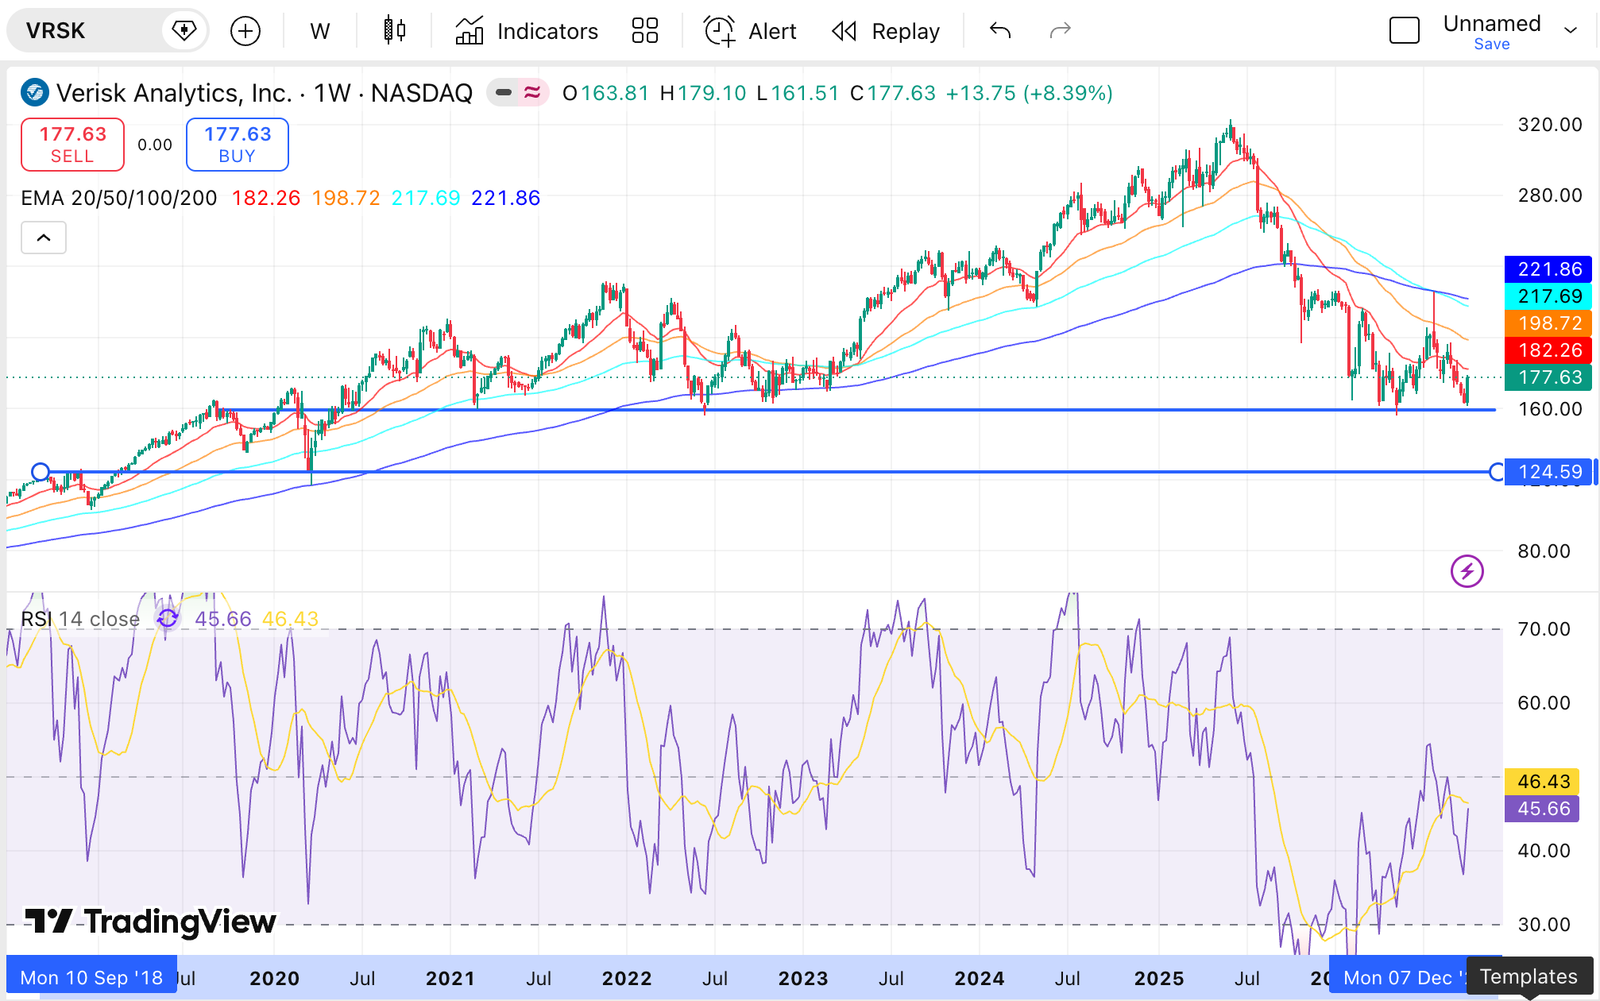
For VRSK stock I like to analyse a weekly timeframe. I like the support at 160$ level, and it was my entry point for starting a position on VRSK. I only had that chance in May, and only bought a small position. I would like to increase a little bit if we test the 160$ level.
For now, Verisk is a watch position on my personal portfólio (<1%) but I would like to increase up to 2% if we get 160$ again.
For VRSK to be a core position, I would like to see 125$. At that level, Verisk will be a good risk/reward situation.