
MONEYJOURNEY RESEARCH TEMPLATE
S&P Global Inc (SPGI)

QUALITY VALUE INVESTING RESEARCH
| SECTOR Financial — Financial Data & Stock Exchanges |
PRICE AT ANALYSIS $386.27 |
MARKET CAP $113.87B |
DATE October 4, 2026 |
| FAIR VALUE $427.57 |
MARGIN OF SAFETY 9.7% |
QUALITY SCORE 88.8 / 100 |
SIGNAL Buy |
| TL;DR — EXECUTIVE SUMMARY Verdict — Buy — shares trade at $386.27 against a probability-weighted fair value of $427.57, a margin of safety of 9.7% and an expected annual return of 11.8%. Business quality — S&P Global is an exceptional financial infrastructure business with elite 44.6% operating margins and an 88.8 Quality Score, driven by pricing power and recurring revenue. Key risk — The key risk is cyclical weakness in bond issuance; long-term investors should view the Buy signal as an opportunity to acquire a premier compounder below fair value. |
01 — MoneyJourney Introduction
This report follows the MoneyJourney quality value investing framework: understand the business first, assess its quality and durability, calculate a reasoned estimate of intrinsic value, and only act with a margin of safety. The goal is a repeatable, transparent process — not a prediction.
S&P Global presents an attractive opportunity for quality-value investors as its shares trade at a modest discount to fair value despite its irreplaceable role in global capital market infrastructure. With a forward P/E of 19.1x relative to its historical valuation premium, the stock offers a favorable entry point into a high-margin compounding machine.
02 — The Business
What They Do & How They Make Money
S&P Global Inc is a global financial intelligence powerhouse providing critical benchmark ratings, market data, indices, and analytical workflow tools to institutional markets. Originally built around corporate publishing and debt evaluation, the company has scaled into an essential digital infrastructure provider across international financial ecosystems. Its S&P Global Ratings division generates transaction and subscription revenue by evaluating corporate and sovereign debt creditworthiness. S&P Global Market Intelligence delivers desktop analytics, enterprise data feeds, and workflow software to investment professionals and corporate executives. The S&P Dow Jones Indices segment licenses proprietary benchmarks, including the flagship S&P 500, generating asset-based fees from index-linked financial products. S&P Global Commodity Insights provides price assessments and analytics for energy and resources markets, while the Mobility segment serves automotive industry participants with detailed market intelligence. Together, these complementary business lines create a resilient, recurring revenue model deeply embedded across asset classes, corporates, and financial institutions worldwide.
Competitive Landscape
S&P Global operates in highly concentrated market segments where structural barriers protect incumbent profitability. In credit ratings, its primary rival is Moody’s Corporation, with whom it shares a duopoly that controls over 80% of global debt ratings volume, while Fitch Ratings serves as a smaller third player. In market data and analytics, the company competes against Bloomberg, Refinitiv, and FactSet, leveraging superior proprietary data assets to capture market share. S&P Dow Jones Indices faces main competition from MSCI and FTSE Russell, maintaining a dominant position in U.S. equity benchmark licensing. Across all divisions, S&P Global’s competitive position is firm and holding strong, supported by regulatory designations, high switching costs, and indispensable brand equity.
PEER COMPARISON
| COMPANY | OPERATING MARGIN | ROIC |
| S&P Global Inc (SPGI) | 44.6% | 11.1% |
| Moody’s Corporation (MCO) | 38.5% | 14.2% |
| MSCI Inc. (MSCI) | 54.0% | 24.5% |
| FactSet Research Systems Inc. (FDS) | 33.5% | 17.8% |
Revenue Breakdown
BY SEGMENT
Based on recent public filings, Market Intelligence accounts for approximately 35% of revenue, Credit Ratings represents roughly 30%, Commodity Insights generates around 15%, Indices contributes about 10% to 15%, and Mobility provides roughly 10%.
BY GEOGRAPHY
Geographically, the Americas account for approximately 60% of total revenue, with Europe, the Middle East, and Africa generating roughly 25%, and the Asia-Pacific region representing around 15%.
Competitive Advantages & Moat
- Brand Strength — S&P is a globally trusted benchmark brand for creditworthiness and financial indices built over more than a century.
- Network Effects — Dominant benchmark indices like the S&P 500 create self-reinforcing network effects as financial products and market liquidity concentrate around them.
- Switching Costs — Deep enterprise software integration and regulatory reliance on credit ratings create prohibitive switching costs for institutional clients.
- Cost Advantages / Scale — High fixed costs in proprietary data acquisition and digital infrastructure yield substantial operational leverage as sales volume scales.
- Regulatory / IP Protection — Regulatory designation as a Nationally Recognized Statistical Rating Organization forms a high legal barrier to market entry.
Risk Factors
- A sustained drop in global corporate debt issuance due to persistent high interest rates would significantly impair ratings segment revenue.
- Increased regulatory scrutiny or potential legislative intervention regarding credit rating fees and benchmark licensing power could compress long-term margins.
- Execution risks or delayed synergy realization from integrating large-scale acquisitions could weigh on ROIC expansion.
Bull Case
S&P Global’s dominant market position and pricing power generate expanding 44.6% operating margins and substantial free cash flow. The secular growth in passive investing and enterprise market data, combined with post-merger revenue synergies, positions the company to compound earnings reliably across market cycles.
Bear Case
A prolonged slowdown in global bond issuance could depress revenue in the company’s most profitable division for an extended period. Furthermore, significant net debt of $8.5 billion limits immediate balance sheet flexibility and absorbs cash that could otherwise fund capital return programs.
03 — Fundamentals
Valuation Multiples
| Market Cap ($B) | 113.87 |
| Enterprise Value ($B) | 130.62 |
| EV / EBITDA | 15.6x |
| P/E | 23.5x |
| Forward P/E | 19.1x |
| Forward Earnings Yield | 5.2% |
| P/FCF | 20.4x |
| FCF Yield | 4.9% |
Margins & Growth
| Revenue Growth (5Y) | 9.6% |
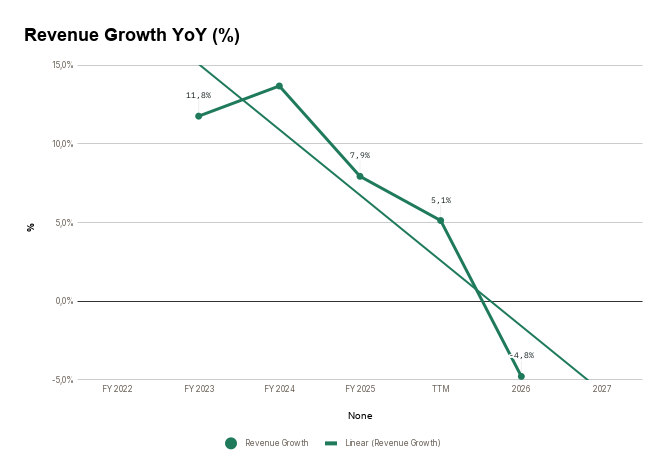
| Sales Growth YoY | 5.1% |
| Gross Margin | 70.9% |
| Operating Margin | 44.6% |
| Net Margin | 30.5% |
Balance Sheet & Returns
| Cash ($M) | 4134 |
| Long-Term Debt ($M) | 12598 |
| Net Cash ($M) | -8464 |
| Years to Pay Debt | 1.7 |
| ROE | 15.2% |
| ROIC | 11.1% |
| 5-Yr Avg ROIC | 9.8% |
Capital Returns
| Dividend Yield | 1.01% |
| Payout Ratio | 26.20% |
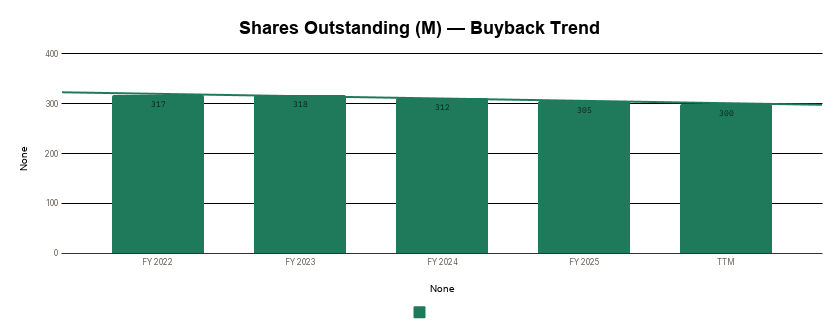
| Buybacks (Share Count Δ) | -1.4% |
| Avg. Distribution Yield | 3.0% |
What the Numbers Show
S&P Global exhibits exceptional profitability, highlighted by a 70.9% gross margin and a 44.6% operating margin that reflect immense pricing power and low variable capital costs. Top-line expansion remains steady, with a 5-year revenue CAGR of 9.6% and recent YoY sales growth of 5.1%, indicating durable demand across market cycles. Capital efficiency is high, evidenced by an ROIC of 11.1% that surpasses its 5-year average of 9.8% as post-merger integration efficiencies continue to materialize. While the balance sheet carries $8.46 billion in net debt following major strategic acquisitions, strong underlying cash generation leaves this well-covered at just 1.7 years to pay off debt.
5-Year Trend — Charts
Revenue, Net Income & Free Cash Flow ($M)

Revenue Growth YoY (%)
Margin Trends (%)

Return on Invested Capital (%)

Net Income/Share & FCF per Share ($)

Shares Outstanding (M) — Buyback Trend
04 — Quality Scorecard
| CRITERION | VALUE / ASSESSMENT | PASS |
| Revenue Growth | 9,6% | ✔ |
| Market Potential / Industry Growth | 11,09% | ✔ |
| Quality of Revenues | Recurring | High |
| Product / Process Development | Yes | Better |
| Research & Development | — | Better |
| High Gross Margins | 70,9% | ✔ |
| Profit Margins | 32,1% | ✔ |
| Maintaining Profit Margins | Yes | ✔ |
| Margins vs. Competition | — | Better |
| Pricing Power | Yes | ✔ |
| Debt Structure | 1,72 | Better |
| Rates of Return (ROIC / ROE) | 9,8% | ✔ |
| Management Depth | — | Extraordinary |
| Culture, Reputation & Labor Relations | — | Good |
| MOAT / Competitive Advantage | Network Effect | Impenetrable / Monopoly |
| MOAT Trend | — | Enduring |
| FCF / Share Growth | 26,1% | ✔ |
| Returns Capital (Dividends/Buybacks) | 3,0% | ✔ |
| QUALITY SCORE | — | 88.8 / 100 |
Scale: 80-100 Exceptional · 60-79 Strong · 40-59 Mixed · Below 40 Weak.
What’s Driving the Score
The score is anchored by strong marks on Rates of Return (ROIC / ROE) (10%), Pricing Power (8%), and FCF / Share Growth (8%) — three of its most heavily weighted criteria. Together, the criteria with a clear pass or fail account for roughly 45% of the total weighting — the rest sit at a middling score rather than a firm strength or weakness.
05 — Valuation
Key Assumptions
| Country | United States |
| Business Risk | Safe |
| Discount Rate | 10.06% |
| Revenue Growth — Base | 8.0% |
| Revenue Growth — Bull | 10.0% |
| Revenue Growth — Bear | 6.0% |
| FCF Margin (2032E) | 36.0% |
| Exit P/E Multiple (Base) | 23.0x |
Scenario Analysis
| CASE | PROB. | REV. GROWTH | EXIT P/E | INTRINSIC VALUE |
| Base Case | 60% | 8.0% | 23.0x | $425.06 |
| Bull Case | 20% | 10.0% | 25.0x | $510.25 |
| Bear Case | 20% | 6.0% | 21.0x | $352.43 |
Probability-Weighted Fair Value
| FAIR VALUE $427.57 |
NET CASH / SHARE $-28.71 |
MARGIN OF SAFETY 9.7% |
EXPECTED ANN. RETURN 11.8% |
What This Means
At $386.27, the current stock price sits below the base scenario fair value of $425.06 and offers a 9.7% margin of safety against an estimated fair value of $427.57. Driven by a forward P/E of 19.1x and a 4.9% free cash flow yield, the valuation supports an expected annual return of 11.8% within a fair value distribution ranging from $352.43 in a bear case to $510.25 in a bull case.
Sensitivity Analysis
Intrinsic Value ($ / share) — Discount Rate × Exit P/E
| DISC. RATE ↓ / EXIT P/E → | 19x | 23x | 27x |
| 9.1% | 370.91 | 448.99 | 527.08 |
| 10.1% | 351.14 | 425.06 | 498.99 |
| 11.1% | 332.59 | 402.61 | 472.63 |
Intrinsic Value ($ / share) — Revenue CAGR × FCF Margin
| REV. CAGR ↓ / FCF MARGIN → | 34.0% | 36.0% | 38.0% |
| 7.0% | 378.11 | 401.20 | 424.30 |
| 8.0% | 400.65 | 425.06 | 449.48 |
| 9.0% | 424.25 | 450.06 | 475.86 |
Revenue CAGR ± 1 pt and 2032 FCF margin ± 2 pts around the Base Case; discount rate and exit P/E held at Base Case.
06 — My Take
Overall Conclusion
S&P Global represents an elite, capital-light compounder, reflected in its Quality Score of 88.8/100 driven by elite operating margins and essential market positioning. The current Buy signal and 9.7% margin of safety indicate that the market is offering a reasonable entry price for an asset that rarely trades at a severe discount. The primary risk to this thesis lies in debt capital market cyclicality, as sharp drops in corporate bond issuance volume can temporarily depress ratings revenue. However, the company’s subscription-heavy revenue mix in other divisions provides robust downside protection during cyclical troughs. The bottom line is that long-term investors are getting a high-quality compounder at a fair price with an attractive prospective return profile.
Investment Thesis Check
☒ Is it cheap? (Margin of safety at current price)
☑ Is it a good business? (Quality Score reflects durable fundamentals)
☑ Who is running it? (Management track record checked)
What did I miss? (Deliberately looked for the counter-argument)
3 Sources of Returns
☑ Revenue / Earnings Growth
☑ P/E Expansion
☑ Buybacks and Dividends
| VERDICT BUY |
Entry Execution & Support Levels
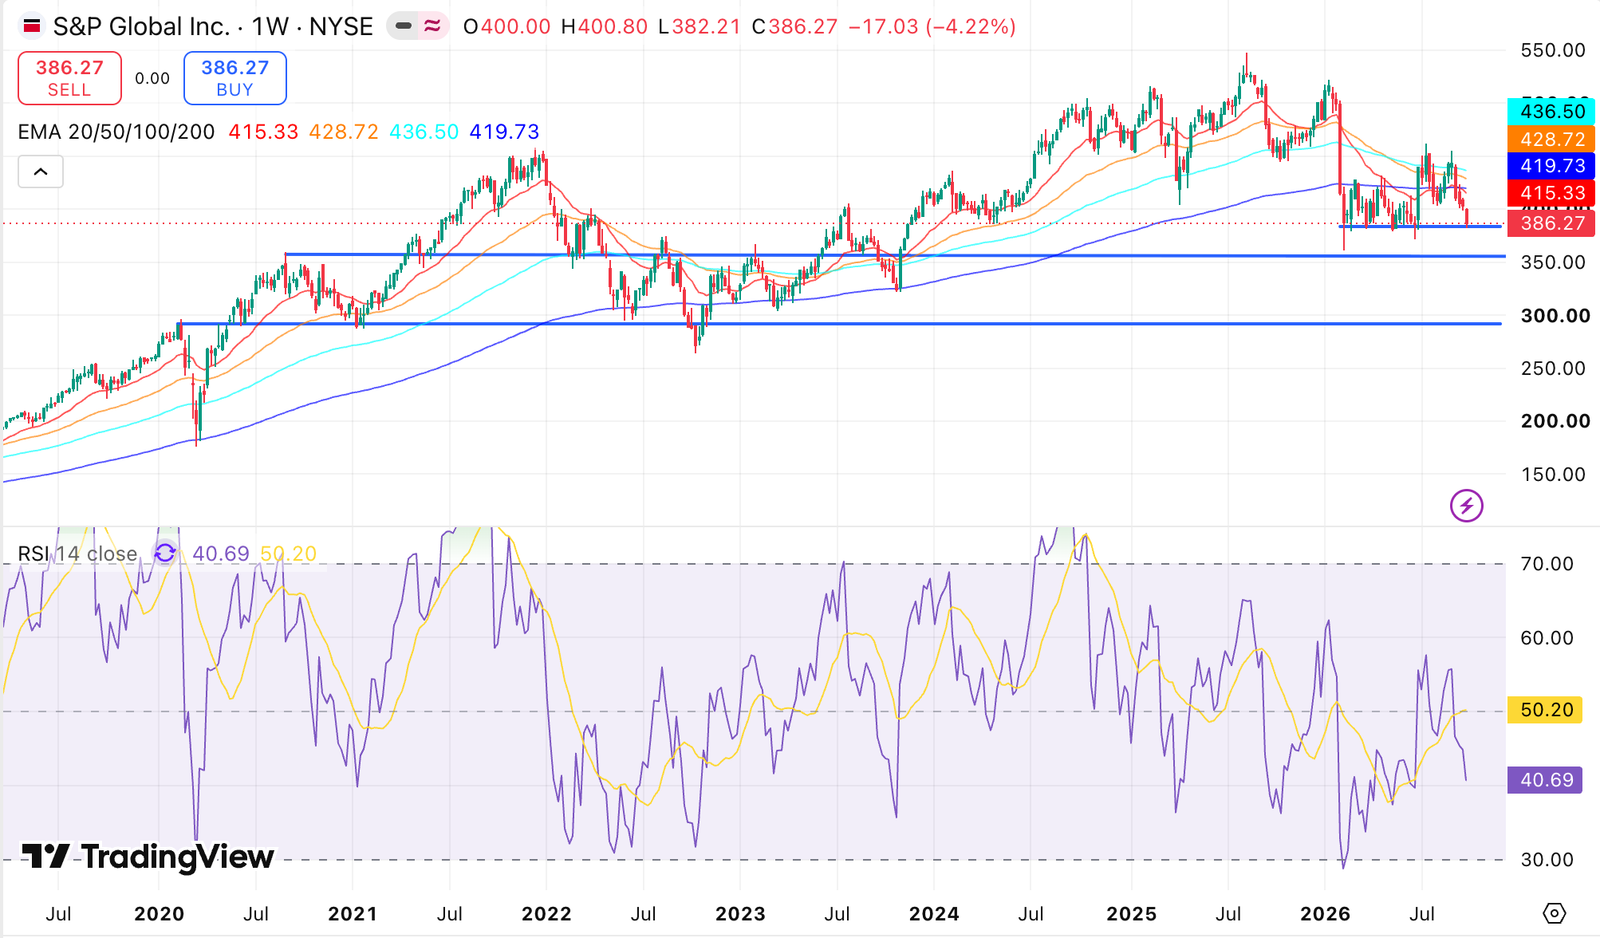
On a weekly timeframe, 385$ , 350$ and 300$ are the next support where the stock can find a bottom. I will be looking into SPGI and think into adding at my position as the stock goes down and reach this levels.
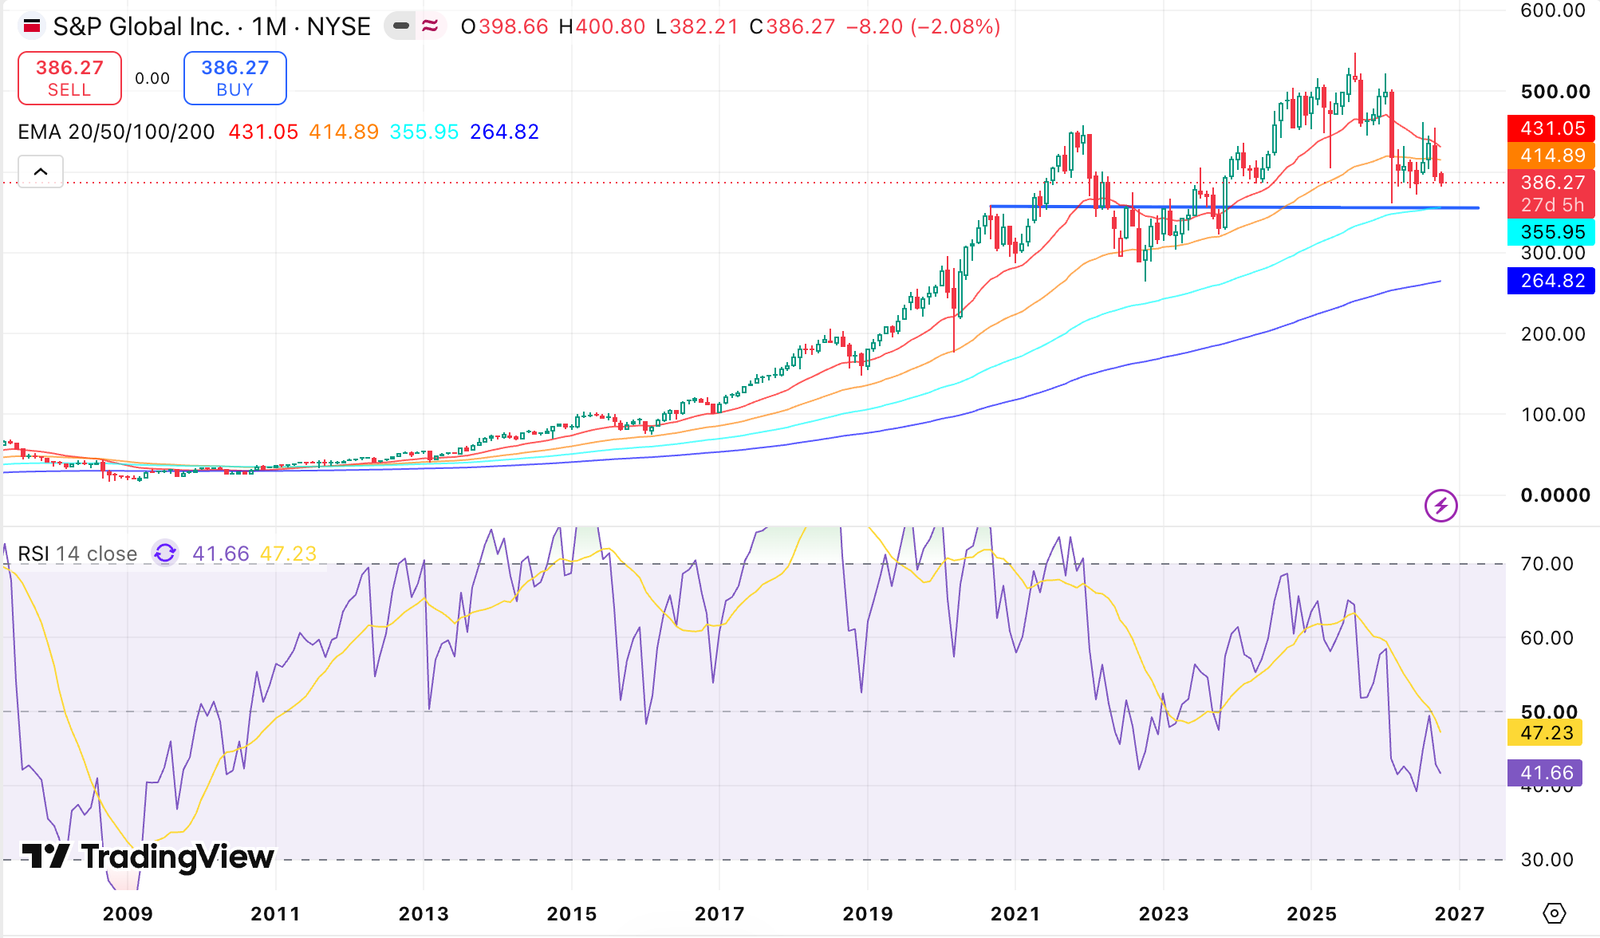
On a monthly timeframe, 100EMA (356$) might be a good support and a good entry point for long investors.