
MONEYJOURNEY RESEARCH
Generac Holdings Inc (GNRC)
QUALITY VALUE INVESTING RESEARCH
| SECTOR Industrials — Specialty Industrial Machinery |
PRICE AT ANALYSIS $173.55 |
MARKET CAP $10.25B |
DATE November 6, 2026 |
| FAIR VALUE $150.86 |
MARGIN OF SAFETY -15.0% |
QUALITY SCORE 62.4 / 100 |
SIGNAL Hold |
| TL;DR — EXECUTIVE SUMMARY Verdict — Hold — shares trade at $173.55 against a probability-weighted fair value of $150.86, a margin of safety of -15.0% and an expected annual return of 9.0%. Business quality — Generac is a strong category leader in home power resilience with a solid 62.4 Quality Score, healthy 39.9% gross margins, and dominant residential market share. Key risk — Unpredictable weather-driven demand is the chief risk; given the Hold signal and -15.0% margin of safety, investors should wait for a better entry price. |
01 — MoneyJourney Introduction
This report follows the MoneyJourney quality value investing framework: understand the business first, assess its quality and durability, calculate a reasoned estimate of intrinsic value, and only act with a margin of safety. The goal is a repeatable, transparent process — not a prediction.
Generac commands a dominant market position in residential standby generators, offering an intriguing setup as cyclical post-pandemic channel inventory destocking normalizes alongside growing structural tailwinds from grid instability. A value investor might evaluate whether current price levels reflect overblown short-term earnings volatility rather than the business’s durable long-term cash generation capabilities.
02 — The Business
What They Do & How They Make Money
Founded in 1959, Generac Holdings Inc. is a leading global designer and manufacturer of energy technology solutions and power generation equipment. The company pioneered the residential automatic standby generator market and remains the dominant market leader in North America. Generac operates primarily through three main reporting avenues: Residential Products, Commercial & Industrial (C&I) Products, and Other/Services. Residential Products generates revenue by selling home standby generators, portable generators, energy storage systems, and home energy management software through an extensive omni-channel dealer network. The C&I division designs and builds stationary megawatt-level generators, mobile light towers, and backup power solutions for telecom, industrial facilities, healthcare, and data centers. The company has increasingly integrated clean energy technology, including solar microinverters and battery storage system capabilities, to transition into a broader energy technology platform. Generac sells its products globally across North America, South America, Europe, and Asia-Pacific, serving residential homeowners, commercial enterprises, utility clients, and institutional customers.
Competitive Landscape
Generac holds a dominant, multi-decade market share exceeding 70% in North American residential standby power, where its extensive dealer and installer network creates significant distribution advantages over key industrial power competitors like Cummins and Kohler. In the Commercial & Industrial segment, Generac faces tougher competition from entrenched global capital goods peers such as Caterpillar and Cummins, where scale and broad international distribution channels are paramount. In the emerging residential battery storage and solar technology market, the company competes against specialized clean energy players like Tesla and Enphase, where its positioning remains weaker due to rapid technological evolution and early execution hurdles. Generac’s core legacy market position in residential standby power remains firm and structurally advantaged, though its expansion into adjacent clean energy technologies faces competitive pressure.
Revenue Breakdown
BY SEGMENT
Residential Products represents roughly 55% to 60% of total revenue, while Commercial & Industrial Products contribute approximately 30% to 35%, with the remainder driven by clean energy technologies, parts, and services.
BY GEOGRAPHY
Domestic sales in the United States account for approximately 85% of consolidated net sales, with international markets contributing the remaining 15%.
Competitive Advantages & Moat
- Brand Strength — Generac possesses a strong, category-defining brand in residential standby power supported by an extensive nationwide network of certified dealers and installers.
- Network Effects — Limited
- Switching Costs — Moderate dealer and installer relationships create localized lock-in, but consumer switching costs between equipment brands remain low.
- Cost Advantages / Scale — Manufacturing scale in home standby units yields significant unit cost advantages over lower-volume competitors.
- Regulatory / IP Protection — Limited
Risk Factors
- Extreme weather volatility and unpredictable power outage activity can cause unpredictable swing cycles in consumer generator demand.
- Slower-than-expected adoption and execution issues within the clean energy and battery storage segments could weigh on long-term capital efficiency.
- High interest rates and tightening consumer credit can delay big-ticket discretionary purchases like home standby generators.
Bull Case
Accelerating grid instability and frequent severe weather events drive sustained consumer adoption of home standby generators, solidifying high-margin market leadership. Simultaneously, successful scaling of clean energy storage products expands the addressable market and drives operating leverage back toward historical peak margins.
Bear Case
A prolonged period of mild weather suppresses generator sales, leaving expensive distribution inventory stranded while high debt service burdens net profit. Additionally, persistent competition and execution delays in battery storage prevent Generac from earning returns above its cost of capital on new energy technology investments.
03 — Fundamentals
Valuation Multiples
| Market Cap ($B) | 10.25 |
| Enterprise Value ($B) | 11.20 |
| EV / EBITDA | 13.4x |
| P/E | 34.4x |
| Forward P/E | 12.4x |
| Forward Earnings Yield | 8.0% |
| P/FCF | 24.7x |
| FCF Yield | 4.0% |
Margins & Growth
| Revenue Growth (5Y) | 0.7% |
| Sales Growth YoY | 9.7% |
| Gross Margin | 39.9% |
| Operating Margin | 13.3% |
| Net Margin | 6.5% |
Balance Sheet & Returns
| Cash ($M) | 394 |
| Long-Term Debt ($M) | 1244 |
| Net Cash ($M) | -850 |
| Years to Pay Debt | 2.8 |
| ROE | 10.7% |
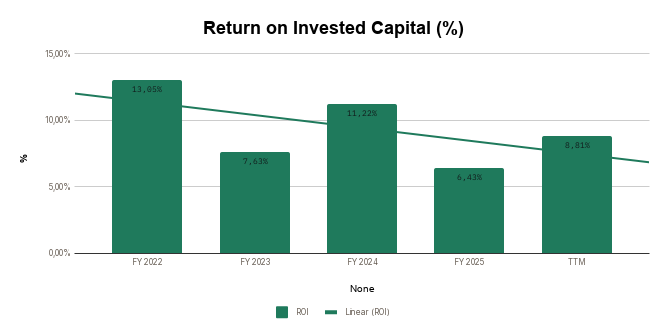
| ROIC | 8.8% |
| 5-Yr Avg ROIC | 9.4% |
Capital Returns
| Dividend Yield | —% |
| Payout Ratio | 0.00% |
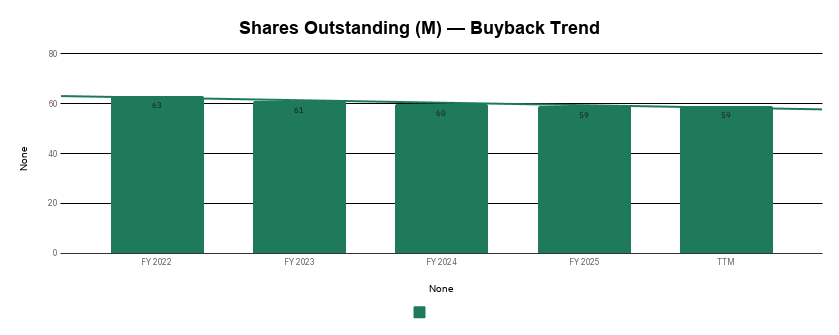
| Buybacks (Share Count Δ) | -1.6% |
| Avg. Distribution Yield | 1.6% |
What the Numbers Show
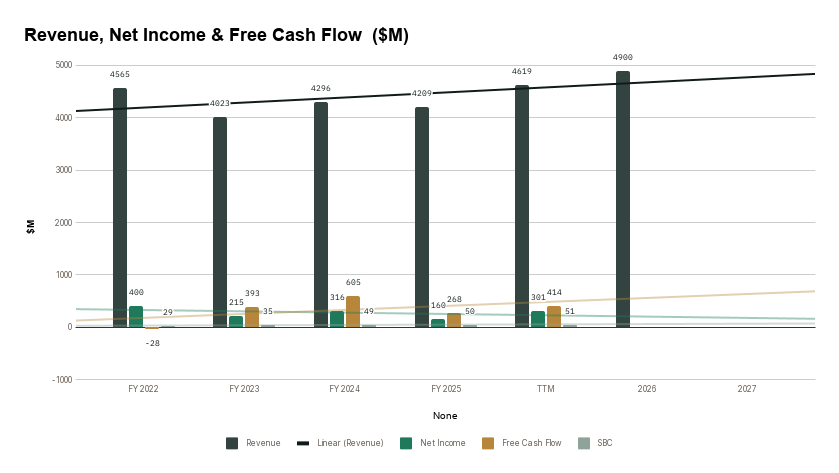
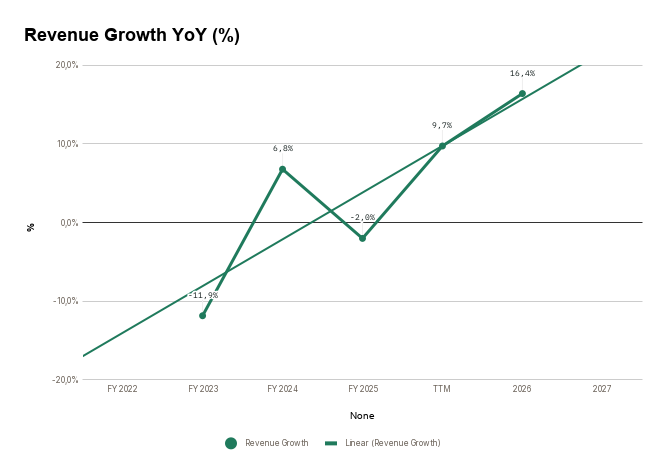
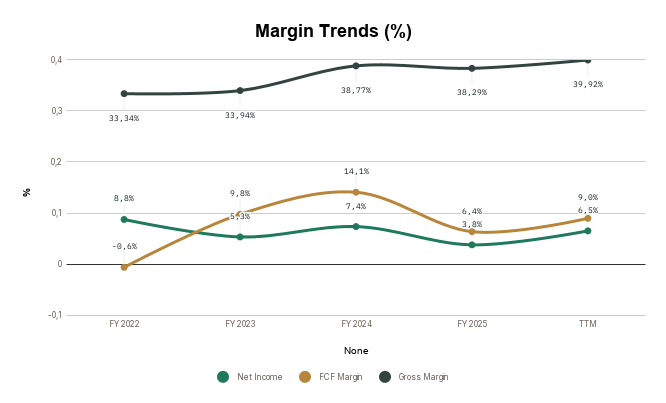
Generac’s top-line profile exhibits cyclical swings, reflected in a muted 5-year annualized revenue growth of 0.7% contrasted against a recent YoY sales rebound of 9.7%. While gross margins remain solid at 39.9%, a net margin of 6.5% highlights elevated operating expenditures and interest drag from its $850 million net debt burden, which currently takes 2.8 years of cash flow to pay down. The sharp divergence between the trailing P/E of 34.4x and forward P/E of 12.4x reflects market expectations of a significant near-term cyclical rebound in operating earnings. Meanwhile, current capital efficiency metrics—demonstrated by an 8.8% ROIC versus its 9.4% 5-year average—indicate that recent capital investments in clean energy technology have yet to consistently earn returns above the cost of capital.
5-Year Trend — Charts
Revenue, Net Income & Free Cash Flow ($M)
Revenue Growth YoY (%)
Margin Trends (%)
Return on Invested Capital (%)
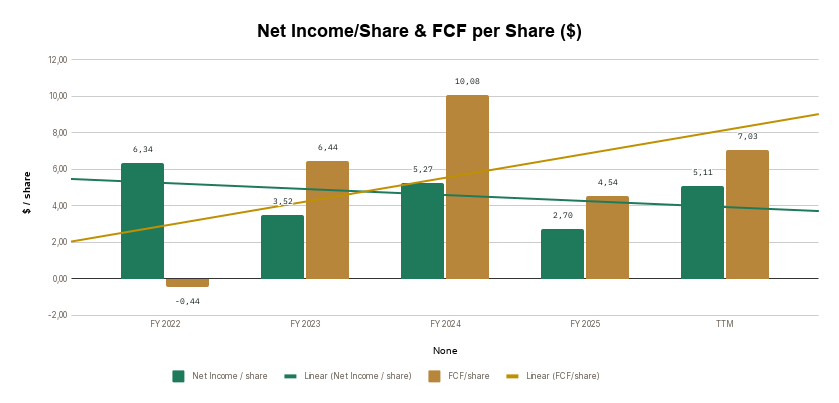
Net Income/Share & FCF per Share ($)
Shares Outstanding (M) — Buyback Trend
04 — Quality Scorecard
| CRITERION | VALUE / ASSESSMENT | PASS |
| Revenue Growth | 0,7% | ✔ |
| Market Potential / Industry Growth | 39,47% | ✔ |
| Quality of Revenues | Cyclical | Low |
| Product / Process Development | Yes | Better |
| Research & Development | — | Average |
| High Gross Margins | 36,9% | ✔ |
| Profit Margins | 7,7% | ✔ |
| Maintaining Profit Margins | Yes | ✔ |
| Margins vs. Competition | — | Average |
| Pricing Power | Yes | ✔ |
| Debt Structure | 2,82 | Better |
| Rates of Return (ROIC / ROE) | 9,4% | ✔ |
| Management Depth | — | Competent |
| Culture, Reputation & Labor Relations | — | Average |
| MOAT / Competitive Advantage | Intangible Assets | Sustainable |
| MOAT Trend | — | Enduring |
| FCF / Share Growth | 18,7% | ✔ |
| Returns Capital (Dividends/Buybacks) | 1,6% | ✔ |
| QUALITY SCORE | — | 62.4 / 100 |
Scale: 80-100 Exceptional · 60-79 Strong · 40-59 Mixed · Below 40 Weak.
What’s Driving the Score
The score is anchored by strong marks on Rates of Return (ROIC / ROE) (10%), Pricing Power (8%), and FCF / Share Growth (8%) — three of its most heavily weighted criteria. Together, the criteria with a clear pass or fail account for roughly 45% of the total weighting — the rest sit at a middling score rather than a firm strength or weakness.
05 — Valuation
Key Assumptions
| Country | United States |
| Business Risk | Low |
| Discount Rate | 12.00% |
| Revenue Growth — Base | 11.0% |
| Revenue Growth — Bull | 14.0% |
| Revenue Growth — Bear | 8.0% |
| FCF Margin (2032E) | 11.0% |
| Exit P/E Multiple (Base) | 18.0x |
Scenario Analysis
| CASE | PROB. | REV. GROWTH | EXIT P/E | INTRINSIC VALUE |
| Base Case | 60% | 11.0% | 18.0x | $147.83 |
| Bull Case | 20% | 14.0% | 20.0x | $206.69 |
| Bear Case | 20% | 8.0% | 16.0x | $104.14 |
Probability-Weighted Fair Value
| FAIR VALUE $150.86 |
NET CASH / SHARE $-14.46 |
MARGIN OF SAFETY -15.0% |
EXPECTED ANN. RETURN 9.0% |
What This Means
Trading at $173.55 against a base-case Fair Value of $147.83, Generac carries a negative 15.0% margin of safety, placing the stock in Hold territory. While the wide scenario range spanning $104.14 in a Bear case to $206.69 in a Bull case underscores significant operational leverage to major power outage events, the current market price leaves little margin of error for operational slip-ups.
Sensitivity Analysis
Intrinsic Value ($ / share) — Discount Rate × Exit P/E
| DISC. RATE ↓ / EXIT P/E → | 14x | 18x | 22x |
| 11.0% | 121.33 | 156.00 | 190.67 |
| 12.0% | 114.98 | 147.83 | 180.68 |
| 13.0% | 109.01 | 140.15 | 171.30 |
Intrinsic Value ($ / share) — Revenue CAGR × FCF Margin
| REV. CAGR ↓ / FCF MARGIN → | 9.0% | 11.0% | 13.0% |
| 10.0% | 109.03 | 138.72 | 168.40 |
| 11.0% | 116.48 | 147.83 | 179.17 |
| 12.0% | 124.28 | 157.36 | 190.44 |
06 — My Take
Overall Conclusion
Generac represents a strong core franchise backed by a Quality Score of 62.4/100, anchored by an unmatched brand presence and distribution network in residential power resilience. However, the valuation presents a Hold signal with a -15.0% margin of safety, as the current market price already discounts a meaningful earnings recovery reflected in its lower forward multiple. The single biggest risk to this thesis is prolonged channel inventory digestion or weak consumer spending dampening big-ticket home improvement demand. Investors should wait for a wider margin of safety closer to $150 before committing fresh capital.
Investment Thesis Check
☒ Is it cheap? (Margin of safety at current price)
☒ Is it a good business? (Quality Score reflects durable fundamentals)
☐ Who is running it? (Management track record checked)
☐ What did I miss? (Deliberately looked for the counter-argument)
3 Sources of Returns
☑ Revenue / Earnings Growth
☒ P/E Expansion
☑ Buybacks and Dividends
| VERDICT HOLD |
Entry Execution & Support Levels
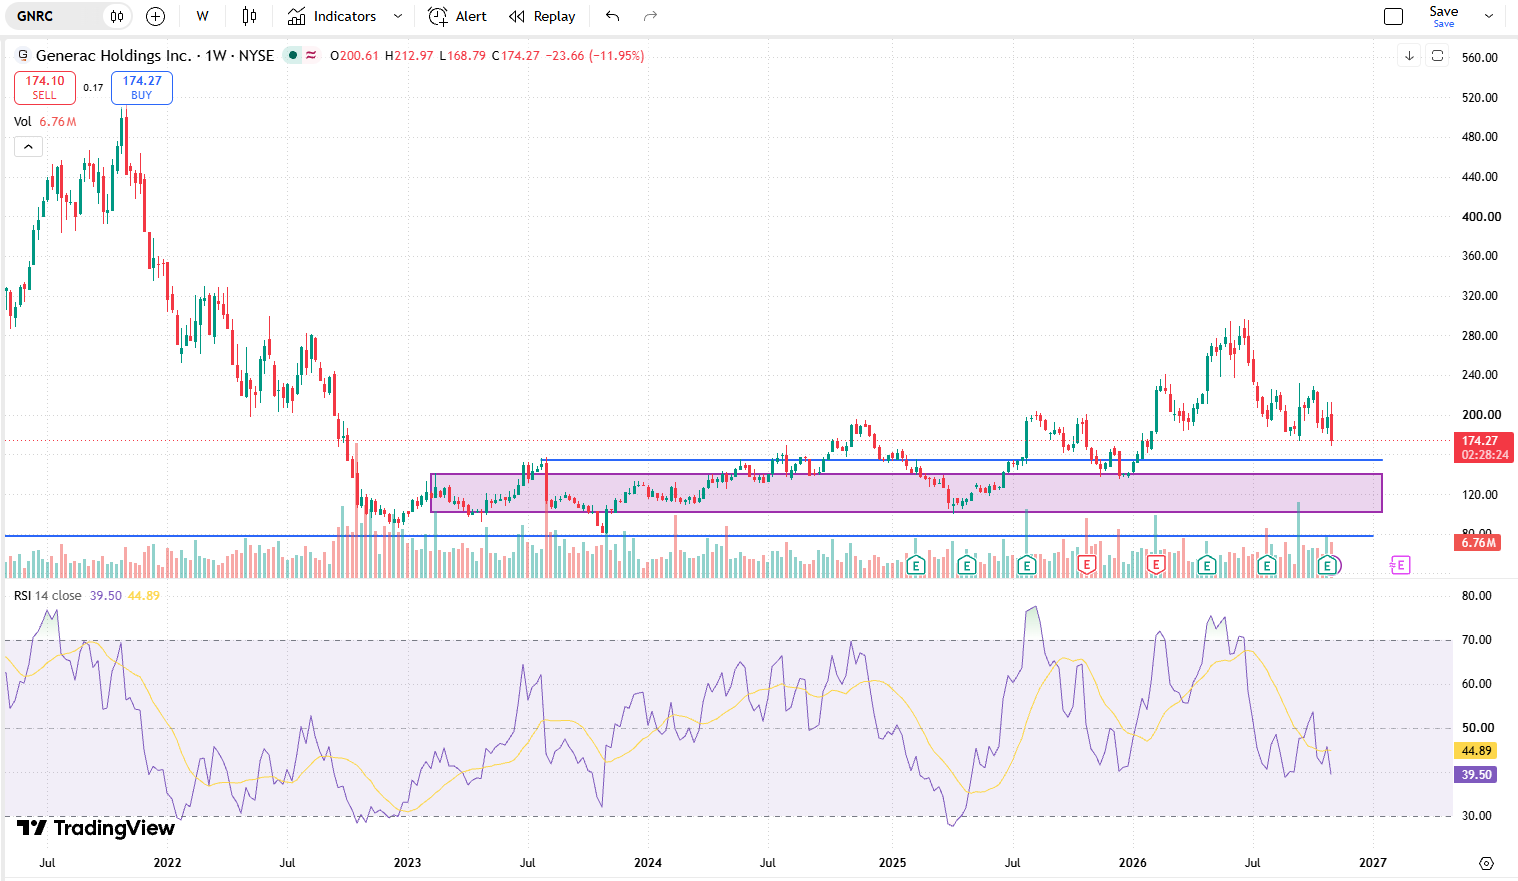
Below 140$ level, doesn’t make sense for me to invest. The risk reward situation, based on our valuation and quality assessment, is not worth it. There are better opportunities in the market. We will wait for the down to drop even further, and analyse again.