
MONEYJOURNEY RESEARCH
Lam Research Corp (LRCX)

QUALITY VALUE INVESTING RESEARCH
| SECTOR Technology — Semiconductor Equipment & Materials |
PRICE AT ANALYSIS $210.83 |
MARKET CAP $263.36B |
DATE November 16, 2026 |
| FAIR VALUE $211.01 |
MARGIN OF SAFETY 0.1% |
QUALITY SCORE 84.8 / 100 |
SIGNAL Buy |
| TL;DR — EXECUTIVE SUMMARY Verdict — Buy — shares trade at $210.83 against a probability-weighted fair value of $211.01, a margin of safety of 0.1% and an expected annual return of 11.6%. Business quality — Lam Research is an exceptional semiconductor equipment vendor generating 79.1% ROIC and 37% operating margins, scoring 84.8/100 for overall quality. Key risk — Memory capex volatility and China export controls are key risks; long-term value investors should accumulate this Buy-rated compounder given its reasonable 17.4x forward P/E. |
01 — MoneyJourney Introduction
This report follows the MoneyJourney quality value investing framework: understand the business first, assess its quality and durability, calculate a reasoned estimate of intrinsic value, and only act with a margin of safety. The goal is a repeatable, transparent process — not a prediction.
A quality value investor would re-evaluate Lam Research due to its rare combination of structural high capital efficiency and market leadership in critical semiconductor equipment processes. Despite trading near its intrinsic fair value, the company’s strong forward earnings expansion potential provides an appealing long-term entry opportunity.
02 — The Business
What They Do & How They Make Money
Founded in 1980, Lam Research Corporation is a global supplier of innovative wafer fabrication equipment and services to the semiconductor industry. The company specializes in market-leading etch and deposition process steps that enable chipmakers to build increasingly complex, three-dimensional microelectronic structures. Its business is principally organized into two core areas: Systems equipment sales and the Customer Support Business Group (CSBG). The Systems unit designs and manufactures advanced tools—such as plasma etch systems and chemical vapor deposition technology—essential for creating features on memory and logic devices. The CSBG segment monetizes the vast installed base by delivering high-margin spare parts, field service, tool upgrades, and technical maintenance throughout the operational lifecycle. Lam serves major global semiconductor manufacturers, including leading foundry, logic, and memory chip producers such as TSMC, Samsung, SK Hynix, and Micron. Its operational footprint spans design and manufacturing hubs in the United States, Asia, and Europe, closely tied to customer fab locations. By embedding its proprietary technology directly into core manufacturing flows, Lam creates an integrated business model where new tool installations directly drive decades of recurring service revenue.
Competitive Landscape
Lam Research operates in a highly consolidated wafer fabrication equipment market alongside major peers Applied Materials, Tokyo Electron, and KLA Corporation. In its core market of dielectric and conductor etch, Lam maintains a dominant market share position, particularly ahead of Tokyo Electron in high-aspect-ratio 3D NAND etching. Against Applied Materials, Lam competes fiercely across chemical vapor deposition and atomic layer deposition, leveraging superior selectivity and yield performance in advanced nodes. While ASML holds a monopoly in photolithography equipment, Lam maintains strong pricing power because complex etch and deposition tools are increasingly substituted for costly lithography steps via multi-patterning techniques. Overall, Lam’s competitive position remains firmly holding to strengthening as semiconductor architecture shifts further toward 3D structures like Gate-All-Around logic and high-stack memory.
PEER COMPARISON
| COMPANY | OPERATING MARGIN | ROIC |
| Lam Research Corp (LRCX) | 37.0% | 79.1% |
| Applied Materials, Inc. (AMAT) | 29.2% | 36.5% |
| Tokyo Electron Limited (TOELY) | 27.5% | 28.0% |
| KLA Corporation (KLAC) | 39.5% | 48.2% |
Revenue Breakdown
BY SEGMENT
Systems equipment sales account for approximately 60% to 65% of total revenue. The Customer Support Business Group (CSBG) represents roughly 35% to 40% through recurring spare parts, equipment maintenance, and field services.
BY GEOGRAPHY
Geographically, Asian markets—primarily China, Taiwan, and South Korea—account for roughly 75% to 85% of total sales, with the remaining balance distributed across North America and Europe.
Competitive Advantages & Moat
- Brand Strength — Limited
- Network Effects — Limited
- Switching Costs — High switching costs exist as proprietary etch tool recipes are locked into customer fab process flows where changing suppliers risks yield loss.
- Cost Advantages / Scale — Scale advantages in specialized R&D investment and a massive installed base enable lower unit costs for customer service and component sourcing.
- Regulatory / IP Protection — Deep patent portfolios across proprietary etch and deposition chemical techniques create formidable legal and intellectual property entry barriers.
Risk Factors
- High exposure to cyclical memory spending (NAND and DRAM) leaves revenue and earnings vulnerable to steep capex downturns by major chipmakers.
- Escalating geopolitical trade tensions and expanded U.S. export restrictions on equipment sales to China could permanently curtail key international addressable markets.
- Rapid technological shifts or market share gains by competitors in atomic layer deposition or EUV-adjacent etch tools could pressure market position.
Bull Case
The secular expansion of 3D semiconductor architectures, including high-stack 3D NAND and Gate-All-Around logic, significantly expands Lam’s addressable etch and deposition intensity per wafer. Paired with a growing installed base that drives resilient, high-margin CSBG revenues, Lam possesses structural drivers to compound earnings well above baseline industry growth.
Bear Case
A prolonged downturn in memory market capex combined with tighter U.S. government export limits could severely suppress tool shipment volumes and margins. Furthermore, high customer concentration among a small circle of leading fabs amplifies the negative financial impact if any key customer defers fab construction.
03 — Fundamentals
Valuation Multiples
| Market Cap ($B) | 263.36 |
| Enterprise Value ($B) | 259.66 |
| EV / EBITDA | 25.7x |
| P/E | 31.4x |
| Forward P/E | 17.4x |
| Forward Earnings Yield | 5.8% |
| P/FCF | 40.3x |
| FCF Yield | 2.5% |
Margins & Growth
| Revenue Growth (5Y) | 11.9% |
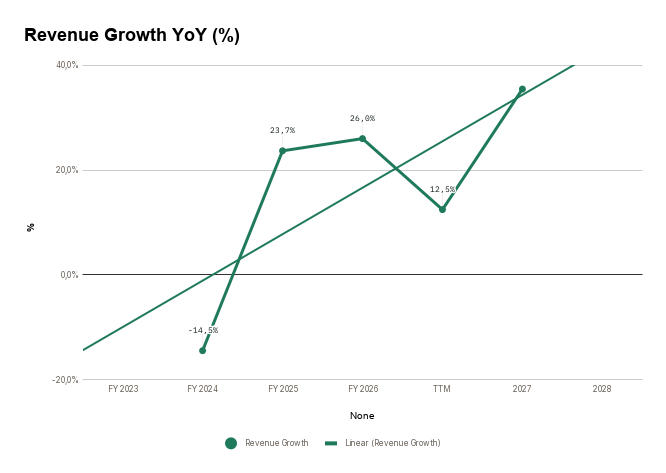
| Sales Growth YoY | 12.5% |
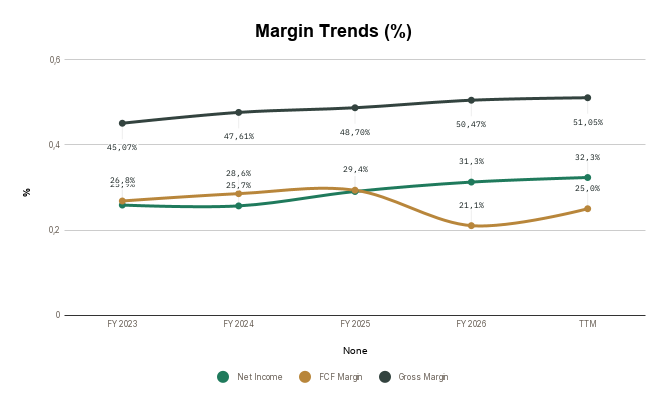
| Gross Margin | 51.0% |
| Operating Margin | 37.0% |
| Net Margin | 32.3% |
Balance Sheet & Returns
| Cash ($M) | 7437 |
| Long-Term Debt ($M) | 3732 |
| Net Cash ($M) | 3705 |
| Years to Pay Debt | -0.4 |
| ROE | 70.1% |
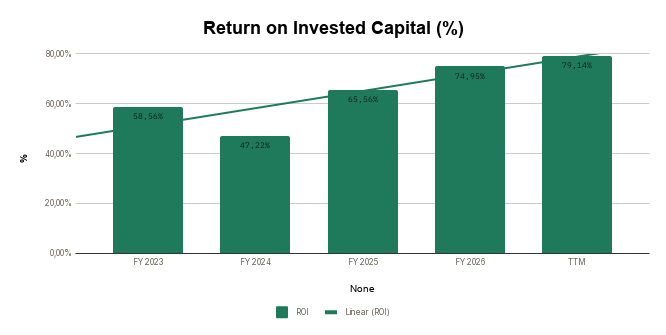
| ROIC | 79.1% |
| 5-Yr Avg ROIC | 65.1% |
Capital Returns
| Dividend Yield | 0.63% |
| Payout Ratio | 18.05% |
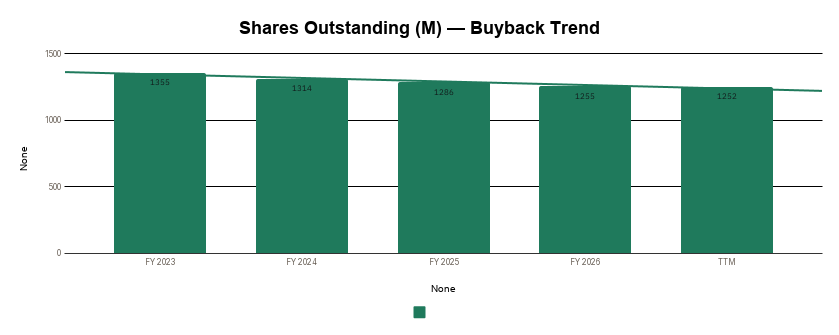
| Buybacks (Share Count Δ) | -2.0% |
| Avg. Distribution Yield | 2.6% |
What the Numbers Show
Lam’s fundamental metrics reveal exceptional operational efficiency, evidenced by an outstanding ROIC of 79.1% and ROE of 70.1%, both well above historical averages. The company converts high gross margins of 51.0% into an impressive net margin of 32.3%, illustrating disciplined cost structure control alongside pricing power. Notably, the drop from a trailing P/E of 31.4x to a forward P/E of 17.4x reflects anticipated strong earnings expansion without requiring dilutive capital raises. Backed by $3.7 billion in net cash and negative debt-payoff years (-0.4), the balance sheet provides a fortress margin of safety to comfortably weather semiconductor capital spending cycles.
5-Year Trend — Charts
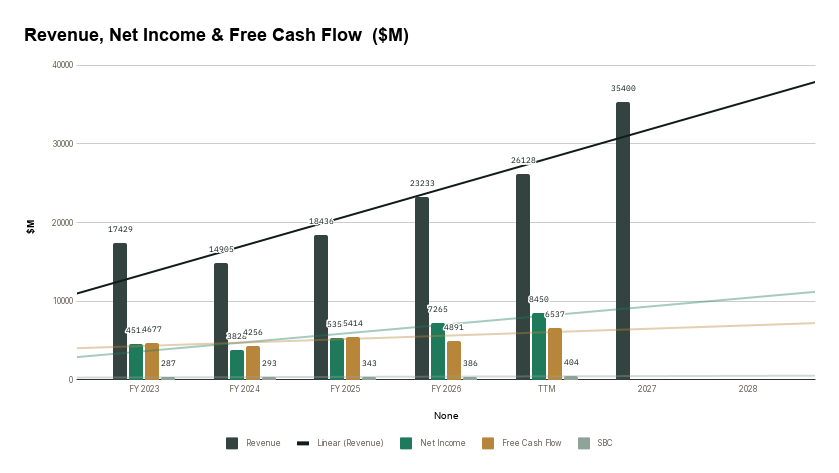
Revenue, Net Income & Free Cash Flow ($M)
Revenue Growth YoY (%)
Margin Trends (%)
Return on Invested Capital (%)
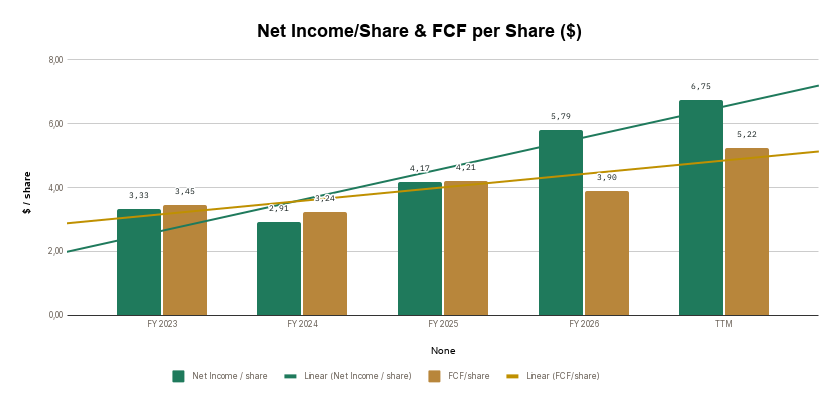
Net Income/Share & FCF per Share ($)
Shares Outstanding (M) — Buyback Trend
04 — Quality Scorecard
| CRITERION | VALUE / ASSESSMENT | PASS |
| Revenue Growth | 11,9% | ✔ |
| Market Potential / Industry Growth | 35,42% | ✔ |
| Quality of Revenues | Consumer Based | Medium |
| Product / Process Development | Yes | Better |
| Research & Development | — | Better |
| High Gross Margins | 48,6% | ✔ |
| Profit Margins | 26,2% | ✔ |
| Maintaining Profit Margins | Yes | ✔ |
| Margins vs. Competition | — | Better |
| Pricing Power | Yes | ✔ |
| Debt Structure | -0,44 | Better |
| Rates of Return (ROIC / ROE) | 65,1% | ✔ |
| Management Depth | — | Very competent |
| Culture, Reputation & Labor Relations | — | Good |
| MOAT / Competitive Advantage | Switching Costs | Wide / Formidable |
| MOAT Trend | — | Widening |
| FCF / Share Growth | 12,6% | ✔ |
| Returns Capital (Dividends/Buybacks) | 2,6% | ✔ |
| QUALITY SCORE | — | 84.8 / 100 |
Scale: 80-100 Exceptional · 60-79 Strong · 40-59 Mixed · Below 40 Weak.
What’s Driving the Score
The score is anchored by strong marks on Rates of Return (ROIC / ROE) (10%), Pricing Power (8%), and FCF / Share Growth (8%) — three of its most heavily weighted criteria. Together, the criteria with a clear pass or fail account for roughly 45% of the total weighting — the rest sit at a middling score rather than a firm strength or weakness.
05 — Valuation
Key Assumptions
| Country | United States |
| Business Risk | Low |
| Discount Rate | 12.00% |
| Revenue Growth — Base | 12.0% |
| Revenue Growth — Bull | 14.0% |
| Revenue Growth — Bear | 10.0% |
| FCF Margin (2032E) | 32.0% |
| Exit P/E Multiple (Base) | 20.0x |
Scenario Analysis
| CASE | PROB. | REV. GROWTH | EXIT P/E | INTRINSIC VALUE |
| Base Case | 60% | 12.0% | 20.0x | $206.04 |
| Bull Case | 20% | 14.0% | 22.0x | $258.80 |
| Bear Case | 20% | 10.0% | 18.0x | $163.30 |
Probability-Weighted Fair Value
| FAIR VALUE $211.01 |
NET CASH / SHARE $2.97 |
MARGIN OF SAFETY 0.1% |
EXPECTED ANN. RETURN 11.6% |
What This Means
At $210.83, the stock trades directly at its Base Fair Value of $211.01 (0.1% margin of safety), suggesting current prices reflect balanced fundamentals while offering a solid 11.6% expected annual return. The valuation scenario range spans from a Bear Case of $163.30 to a Bull Case of $258.80, indicating manageable downside relative to long-term architectural upside.
Sensitivity Analysis
Intrinsic Value ($ / share) — Discount Rate × Exit P/E
| DISC. RATE ↓ / EXIT P/E → | 16x | 20x | 24x |
| 11.0% | 173.95 | 217.43 | 260.92 |
| 12.0% | 164.83 | 206.04 | 247.25 |
| 13.0% | 156.27 | 195.34 | 234.41 |
Intrinsic Value ($ / share) — Revenue CAGR × FCF Margin
| REV. CAGR ↓ / FCF MARGIN → | 30.0% | 32.0% | 34.0% |
| 11.0% | 182.40 | 194.95 | 207.49 |
| 12.0% | 192.80 | 206.04 | 219.28 |
| 13.0% | 203.68 | 217.64 | 231.61 |
06 — My Take
Overall Conclusion
Lam Research represents an elite quality business, reflected in its Quality Score of 84.8/100 and exceptional 79.1% ROIC driven by structural competitive moats. From a valuation perspective, the Buy signal and near-zero margin of safety indicate that while the stock is fairly valued today, its forward P/E of 17.4x makes it attractive for long-term growth. The primary risk to this thesis lies in extreme memory sector capex volatility and heightened geopolitical export controls targeting Asian end-markets. Despite near-term cyclical fluctuations, the company’s compounding capability and net cash strength justify accumulating shares. The bottom line is that Lam is a premier technology franchise that long-term investors can confidently hold or buy on temporary cyclical weakness.
Investment Thesis Check
☒ Is it cheap? (Margin of safety at current price)
☑ Is it a good business? (Quality Score reflects durable fundamentals)
☑ Who is running it? (Management track record checked)
What did I miss? (Deliberately looked for the counter-argument)
3 Sources of Returns
☑ Revenue / Earnings Growth
☒ P/E Expansion
☑ Buybacks and Dividends
| VERDICT BUY |
Entry Execution & Support Levels
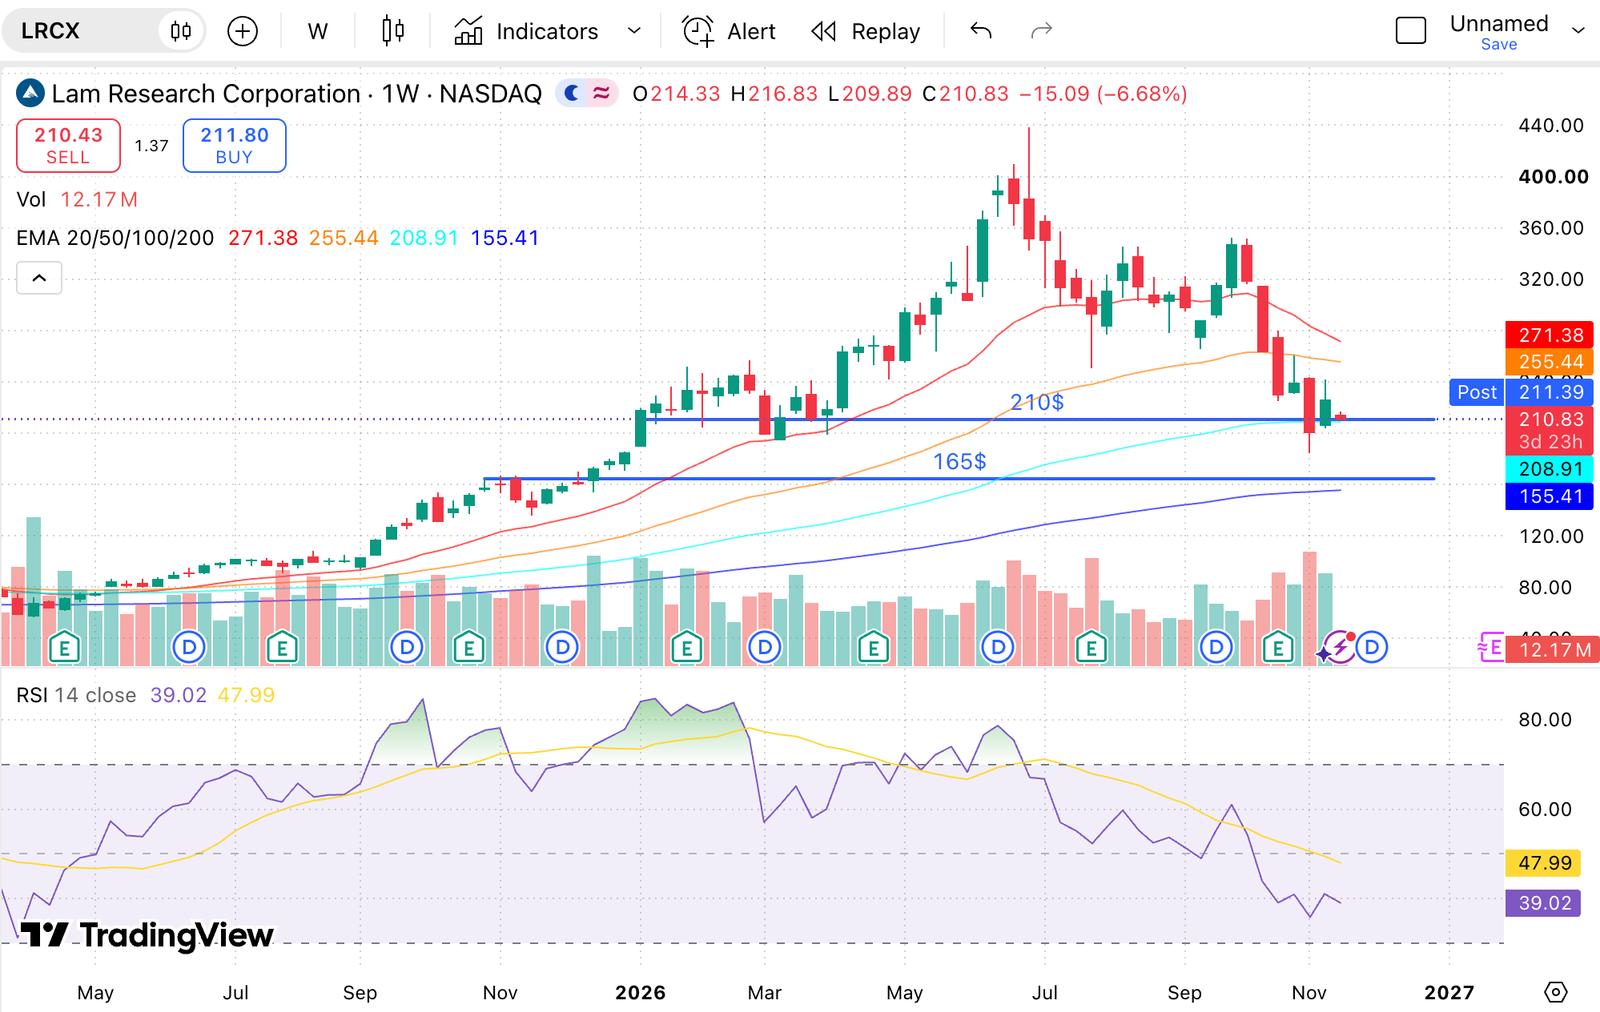
After this latest selloff, LRCX is trading close to a good support around 210$ with the 100 EMA. This is close to our fair value too. If you believe demand will continue in the next few years, this is an attractive entry point. I will probably wait to have a bigger margin of safety, around 165$, close to the 200EMA.