
MONEYJOURNEY RESEARCH
Applied Materials Inc (AMAT)

QUALITY VALUE INVESTING RESEARCH
| SECTOR Technology — Semiconductor Equipment & Materials |
PRICE AT ANALYSIS $350.25 |
MARKET CAP $279.00B |
DATE November 16, 2026 |
| FAIR VALUE $352.28 |
MARGIN OF SAFETY 0.6% |
QUALITY SCORE 82.2 / 100 |
SIGNAL Hold |
| TL;DR — EXECUTIVE SUMMARY Verdict — Hold — shares trade at $350.25 against a probability-weighted fair value of $352.28, a margin of safety of 0.6% and an expected annual return of 11.4%. Business quality — Applied Materials is an exceptional semiconductor capital equipment leader with elite capital efficiency, highlighted by a 42.2% ROIC and a high 82.2 Quality Score. Key risk — Geopolitical trade limits on China pose the key risk; given the Hold signal and 0.6% margin of safety, investors should hold existing shares and wait for pullbacks. |
01 — MoneyJourney Introduction
This report follows the MoneyJourney quality value investing framework: understand the business first, assess its quality and durability, calculate a reasoned estimate of intrinsic value, and only act with a margin of safety. The goal is a repeatable, transparent process — not a prediction.
Applied Materials represents a critical backbone of global semiconductor manufacturing, offering investors exposure to durable technological megatrends like AI and advanced packaging alongside exceptional capital returns. At current valuation levels, the stock trades near intrinsic fair value, presenting a compelling candidate for quality value investors seeking high-return capital allocation with robust operational execution.
02 — The Business
What They Do & How They Make Money
Applied Materials is the world’s largest supplier of semiconductor manufacturing equipment, providing material engineering solutions used to produce virtually every new chip and advanced display in the world. Founded in 1967, the company operates at immense global scale, delivering deposition, etching, chemical mechanical planarization, metrology, and inspection systems. Its operations are organized into three primary business units: Semiconductor Systems, Applied Global Services, and Display and Adjacent Markets. Semiconductor Systems generates the bulk of revenue by manufacturing wafer fabrication equipment across logic, foundry, and memory end-markets. Applied Global Services provides high-margin subscription-like services, maintenance, spare parts, and yield-enhancement software across the installed base of machinery. The Display segment manufactures equipment for flat panel and OLED displays used in consumer electronics and automotive applications. Its customer base includes leading semiconductor fabs and foundry giants like TSMC, Samsung, and Intel. Geographically, revenue is heavily weighted toward major semiconductor manufacturing hubs in Asia, including Taiwan, China, and South Korea, alongside North America and Europe. Together, these segments create a virtuous cycle where hardware sales continuously expand the installed base, driving long-term service revenues and customer stickiness.
Competitive Landscape
Applied Materials possesses the broadest technology portfolio in chipmaking equipment, holding leading positions in deposition and planarization while competing directly against specialized peers. In dry etch and deposition, it competes closely with Lam Research, matching scale and technology while maintaining strong pricing power in advanced logic nodes. In process control and metrology, AMAT competes with segment leader KLA Corporation, where KLA retains a higher-margin niche in defect inspection. Against photolithography monopolist ASML, AMAT complements rather than directly replaces its tools, serving as a critical process partner to enable pattern transfer post-exposure. In Asian markets, it faces Tokyo Electron across etch and clean equipment, but AMAT’s overall position remains firm across primary foundry and logic customers. Overall, AMAT’s competitive position is holding steady due to its critical role in complex gate-all-around and advanced packaging transitions.
PEER COMPARISON
| COMPANY | OPERATING MARGIN | ROIC |
| Applied Materials Inc (AMAT) | 32.9% | 42.2% |
| Lam Research Corporation (LRCX) | 29.5% | 38.2% |
| KLA Corporation (KLAC) | 39.8% | 41.5% |
| ASML Holding N.V. (ASML) | 31.2% | 33.4% |
| Tokyo Electron Limited (TOELY) | 27.1% | 26.8% |
Revenue Breakdown
BY SEGMENT
Semiconductor Systems accounts for approximately 70% to 75% of total net sales, while Applied Global Services generates roughly 20% to 23%. The remaining 3% to 5% is derived from Display and Adjacent Markets.
BY GEOGRAPHY
China represents approximately 30% to 40% of net sales in recent periods, with Taiwan and South Korea contributing roughly 15% to 25% each. The remaining revenues are distributed across North America, Europe, and Japan.
Competitive Advantages & Moat
- Brand Strength — Limited
- Network Effects — Limited
- Switching Costs — High customer switching costs arise because AMAT’s equipment and software are deeply integrated into customers’ complex, highly optimized fab process steps.
- Cost Advantages / Scale — Economies of scale in multi-billion-dollar R&D spending and global field engineering support create immense cost hurdles for potential entrants.
- Regulatory / IP Protection — Extensive global patent coverage across key deposition, etch, and planarization technologies creates a strong intellectual property barrier.
Risk Factors
- Geopolitical tension and expanding trade restrictions targeting technology exports to China could significantly curtail a major portion of high-margin revenues.
- A broader downturn in semiconductor capital expenditure cycles could depress tool orders and gross margins.
- Technological disruption or market share loss in key process steps like etch or deposition to specialized competitors could undermine long-term growth.
Bull Case
AMAT’s dominant exposure to complex chip architectures like Gate-All-Around transistors and advanced 3D packaging drives structural gains in content per wafer. Strong recurring service revenue from an expanding installed base provides resilient cash flow across semiconductor cycles. Exceptional capital efficiency and a pristine balance sheet allow continuous reinvestment alongside disciplined capital return to shareholders.
Bear Case
Increasing geopolitical friction and export control restrictions on advanced wafer fab equipment could permanently impair addressable sales in China. A potential multi-quarter contraction in memory or foundry capex would lead to order cancellations and margin compression. At current price levels with minimal margin of safety, any operational misstep could trigger significant valuation multiple de-rating.
03 — Fundamentals
Valuation Multiples
| Market Cap ($B) | 279.00 |
| Enterprise Value ($B) | 276.19 |
| EV / EBITDA | 23.2x |
| P/E | 27.9x |
| Forward P/E | 14.1x |
| Forward Earnings Yield | 7.1% |
| P/FCF | 45.0x |
| FCF Yield | 2.2% |
Margins & Growth
| Revenue Growth (5Y) | 7.8% |
| Sales Growth YoY | 21.4% |
| Gross Margin | 50.0% |
| Operating Margin | 32.9% |
| Net Margin | 29.3% |
Balance Sheet & Returns
| Cash ($M) | 9339 |
| Long-Term Debt ($M) | 5233 |
| Net Cash ($M) | 4106 |
| Years to Pay Debt | -0.4 |
| ROE | 43.4% |
| ROIC | 42.2% |
| 5-Yr Avg ROIC | 42.7% |
Capital Returns
| Dividend Yield | 0.60% |
| Payout Ratio | 16.24% |
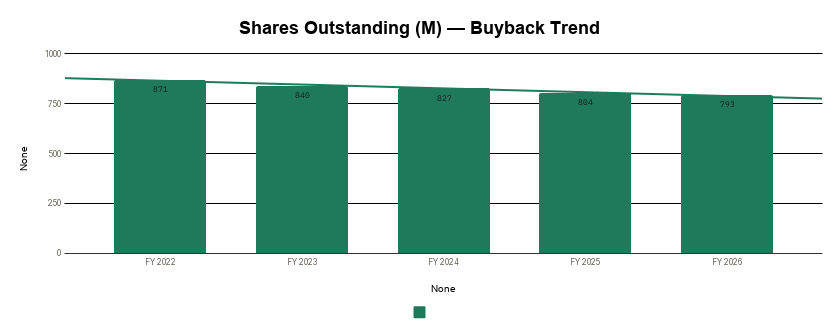
| Buybacks (Share Count Δ) | -2.3% |
| Avg. Distribution Yield | 2.9% |
What the Numbers Show
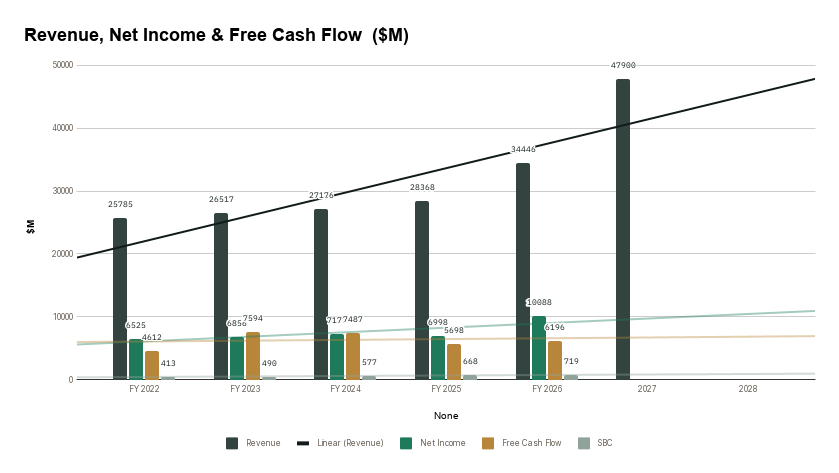
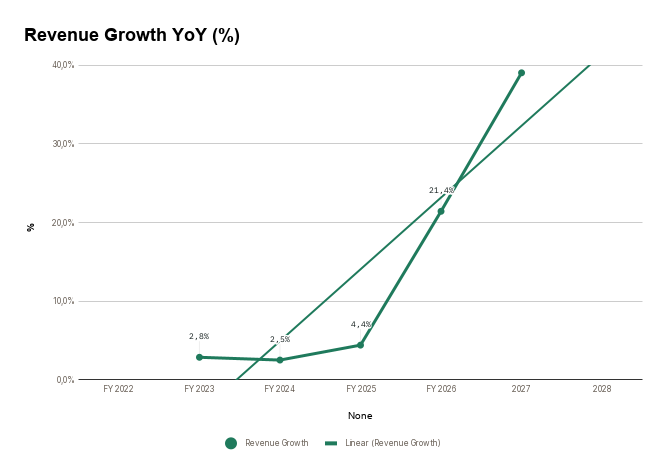
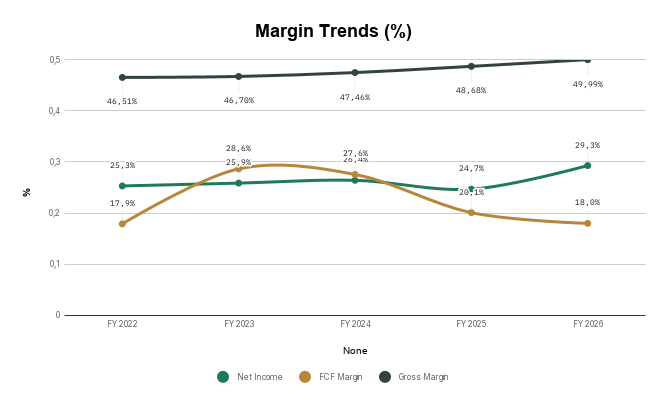
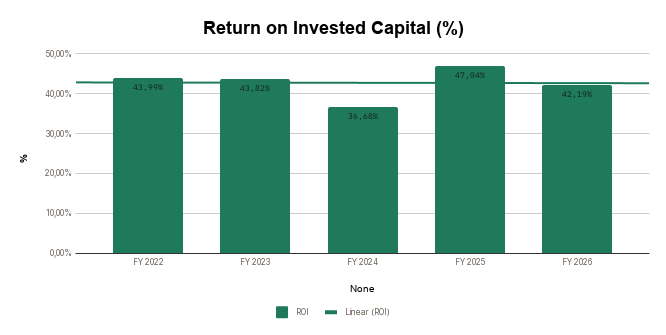
AMAT demonstrates outstanding capital efficiency, highlighted by a current ROIC of 42.2% and a 5-year average ROIC of 42.7%, reflecting disciplined capital allocation and high returns on internal R&D. Recent top-line momentum is strong with 21.4% YoY sales growth—well above its 5-year average of 7.8%—driven by robust demand for advanced packaging and logic node transitions. Operating margins of 32.9% and net margins of 29.3% underscore strong pricing power and cost discipline, even as gross margin sits at 50.0%. Furthermore, a net cash balance of $4,106M and negative net debt timeline (-0.4 years) provide a bulletproof financial safety net to weather cyclical downturns while continuing share repurchases.
5-Year Trend — Charts
Revenue, Net Income & Free Cash Flow ($M)
Revenue Growth YoY (%)
Margin Trends (%)
Return on Invested Capital (%)
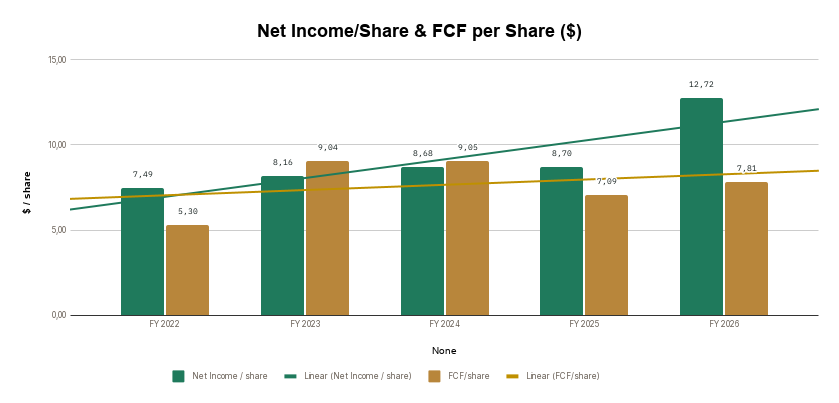
Net Income/Share & FCF per Share ($)
Shares Outstanding (M) — Buyback Trend
04 — Quality Scorecard
| CRITERION | VALUE / ASSESSMENT | PASS |
| Revenue Growth | 7,8% | ✔ |
| Market Potential / Industry Growth | 31,76% | ✔ |
| Quality of Revenues | Consumer Based | Medium |
| Product / Process Development | Yes | Better |
| Research & Development | — | Better |
| High Gross Margins | 47,9% | ✔ |
| Profit Margins | 22,4% | ✔ |
| Maintaining Profit Margins | Yes | ✔ |
| Margins vs. Competition | — | Average |
| Pricing Power | Yes | ✔ |
| Debt Structure | -0,41 | Better |
| Rates of Return (ROIC / ROE) | 42,7% | ✔ |
| Management Depth | — | Very competent |
| Culture, Reputation & Labor Relations | — | Good |
| MOAT / Competitive Advantage | Switching Costs | Wide / Formidable |
| MOAT Trend | — | Widening |
| FCF / Share Growth | 14,9% | ✔ |
| Returns Capital (Dividends/Buybacks) | 2,9% | ✔ |
| QUALITY SCORE | — | 82.2 / 100 |
Scale: 80-100 Exceptional · 60-79 Strong · 40-59 Mixed · Below 40 Weak.
What’s Driving the Score
The score is anchored by strong marks on Rates of Return (ROIC / ROE) (10%), Pricing Power (8%), and FCF / Share Growth (8%) — three of its most heavily weighted criteria. Together, the criteria with a clear pass or fail account for roughly 45% of the total weighting — the rest sit at a middling score rather than a firm strength or weakness.
05 — Valuation
Key Assumptions
| Country | United States |
| Business Risk | Low |
| Discount Rate | 12.00% |
| Revenue Growth — Base | 9.0% |
| Revenue Growth — Bull | 12.0% |
| Revenue Growth — Bear | 7.0% |
| FCF Margin (2032E) | 29.0% |
| Exit P/E Multiple (Base) | 20.0x |
Scenario Analysis
| CASE | PROB. | REV. GROWTH | EXIT P/E | INTRINSIC VALUE |
| Base Case | 60% | 9.0% | 20.0x | $338.72 |
| Bull Case | 20% | 12.0% | 22.0x | $484.30 |
| Bear Case | 20% | 7.0% | 17.0x | $235.08 |
Probability-Weighted Fair Value
| FAIR VALUE $352.28 |
NET CASH / SHARE $5.17 |
MARGIN OF SAFETY 0.6% |
EXPECTED ANN. RETURN 11.4% |
What This Means
At $350.25, the stock trades virtually on top of its calculated Fair Value of $352.28 with a 0.6% Margin of Safety, implying balanced current pricing for disciplined buyers. The wide scenario spread—ranging from a Bear case of $235.08 to a Bull case of $484.30—reflects high sensitivity to semiconductor capital expenditure cycles, though a Forward P/E of 14.1x signals attractive long-term earnings growth relative to trailing levels.
Sensitivity Analysis
Intrinsic Value ($ / share) — Discount Rate × Exit P/E
| DISC. RATE ↓ / EXIT P/E → | 16x | 20x | 24x |
| 11.0% | 285.96 | 357.44 | 428.93 |
| 12.0% | 270.97 | 338.72 | 406.46 |
| 13.0% | 256.90 | 321.13 | 385.35 |
Intrinsic Value ($ / share) — Revenue CAGR × FCF Margin
| REV. CAGR ↓ / FCF MARGIN → | 27.0% | 29.0% | 31.0% |
| 8.0% | 296.43 | 319.61 | 342.79 |
| 9.0% | 314.22 | 338.72 | 363.21 |
| 10.0% | 332.85 | 358.72 | 384.60 |
06 — My Take
Overall Conclusion
Applied Materials is an exceptional, compounder-grade business backed by an 82.2/100 Quality Score, elite ROIC over 40%, and significant cash generation. However, the Hold signal and nominal 0.6% Margin of Safety indicate that the current market price of $350.25 fully reflects its high quality and near-term growth path. The primary risk to this thesis lies in cyclical downturns in global semiconductor capex or heightened geopolitical export restrictions on sales to China. While expected annual returns remain attractive at 11.4%, value investors should wait for a pullback toward the base-case intrinsic fair value around $338 or lower before deploying new capital.
Investment Thesis Check
☒ Is it cheap? (Margin of safety at current price)
☑ Is it a good business? (Quality Score reflects durable fundamentals)
☑ Who is running it? (Management track record checked)
☐ What did I miss? (Deliberately looked for the counter-argument)
3 Sources of Returns
☑ Revenue / Earnings Growth
☒ P/E Expansion
☑ Buybacks and Dividends
| VERDICT HOLD |
Entry Execution & Support Levels
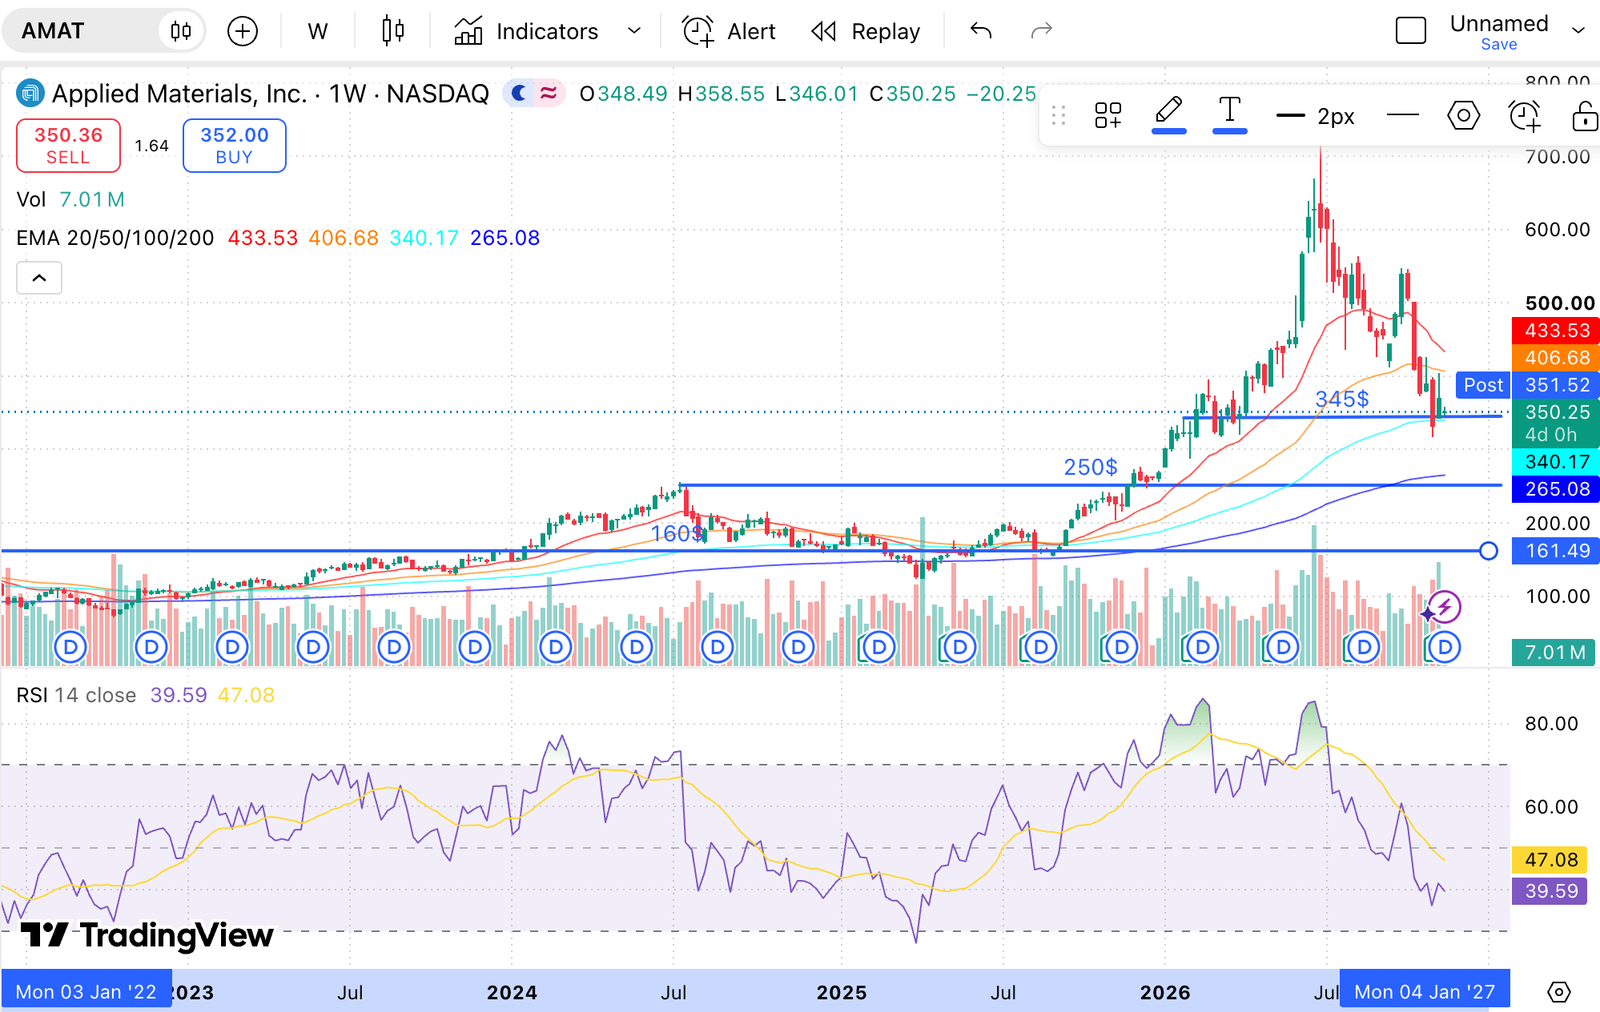
After this latest sellof, AMAT is trading close to a good support around 345$ with the 100 EMA. This is close to our fair value too. If you believe demand will continue in the next few years, this is an attractive entry point. I will probably wait to have a bigger margin of safety, under 300$ or close to the 200EMA at 265$.