
One number for quality and price.
The MJ Score combines how good a business is with how far its price sits below our estimate of its value. It turns into one of five signals, from Strong Buy to Sell.
Two questions, one score.
Both parts matter. A cheap weak business scores low, and so does a great business at a high price. The top of the scale is reserved for great businesses at a clear discount.
Business quality
A 0–100 judgment of how good the business is, built from five things.
- 1MoatHow lasting the competitive advantage is
- 2FundamentalsThe financial track record over time
- 3DilutionWhether stock-based pay is diluting the owners
- 4Skin in the gameWhether insiders own a real stake
- 5Future prospectsWhere the business can go next
Margin of safety
How far today’s price sits below our fair value.
Margin of safety = (fair value − price) ÷ fair value
Illustration with made-up numbers: fair value 100, price 70. The margin of safety is 30%: the price is 30% below fair value.
Five signals, one meaning each.
Strong Buy and Good Buy are our top picks and are shown to Pro members. The counts are live from the Watchlist.
- Strong Buy 90 and above 1 today Worth your closest look. Read the deep dive and check the assumptions before you decide anything.
- Good Buy 70 to 89 7 today A strong candidate. Study it and compare it with what you already own.
- Buy 50 to 69 17 today Attractive at today’s price. A reason to look closer, not an order to buy.
- Hold 0 to 49 30 today Fairly priced. If you own it, there is no discount to add at. If you do not, there is no hurry.
- Sell below 0 5 today The price is above our fair value. A reason to review your position, not an order to sell.
These are prompts for your own research, not advice.
See it on real companies.
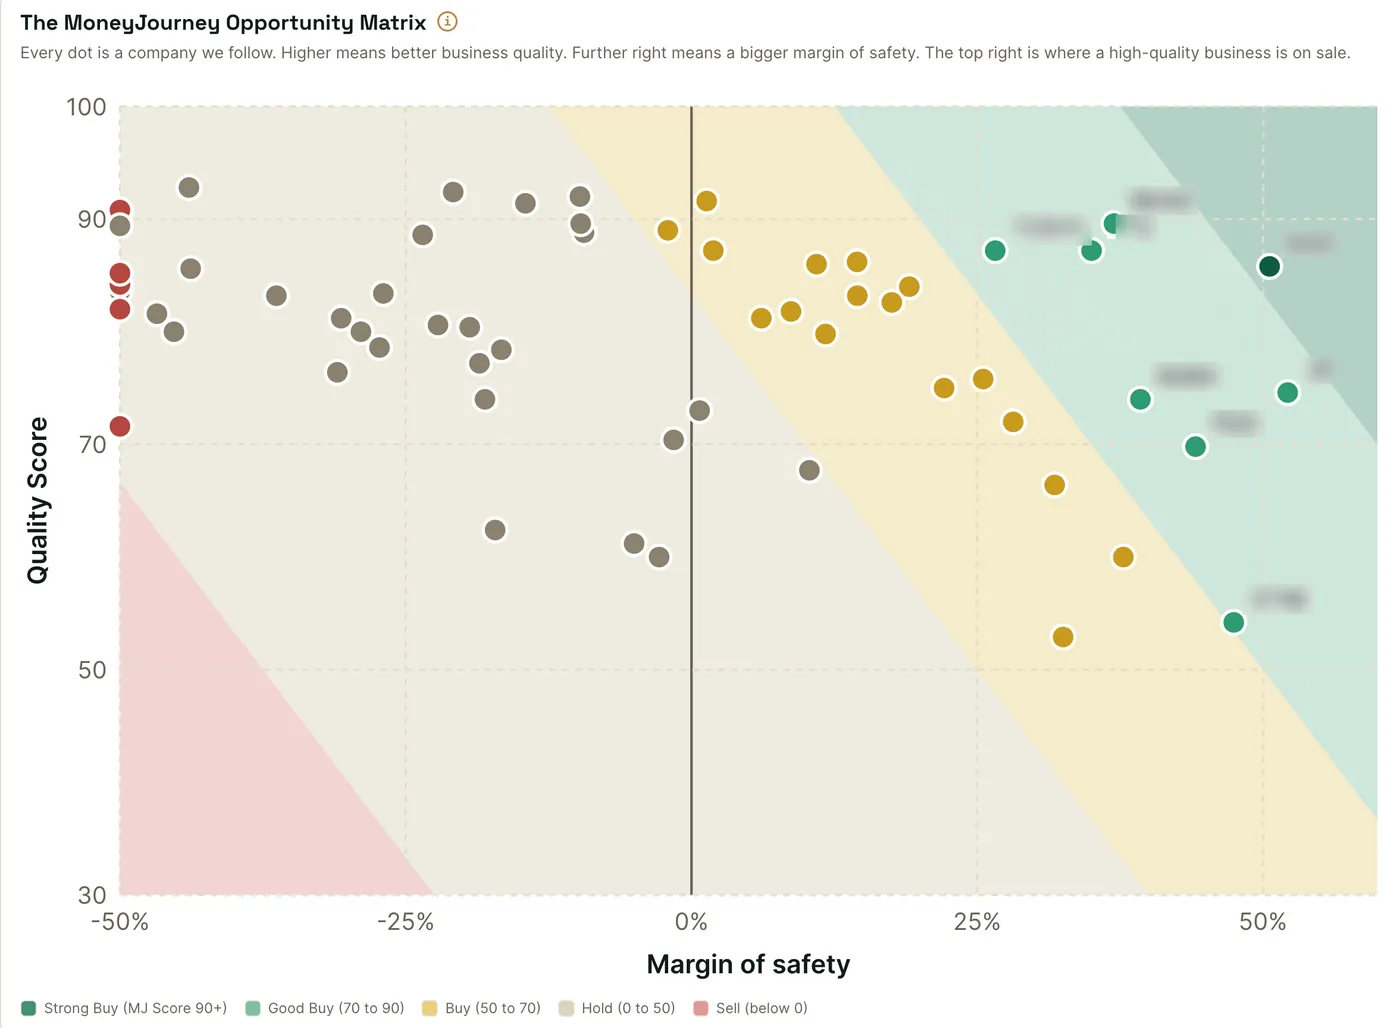
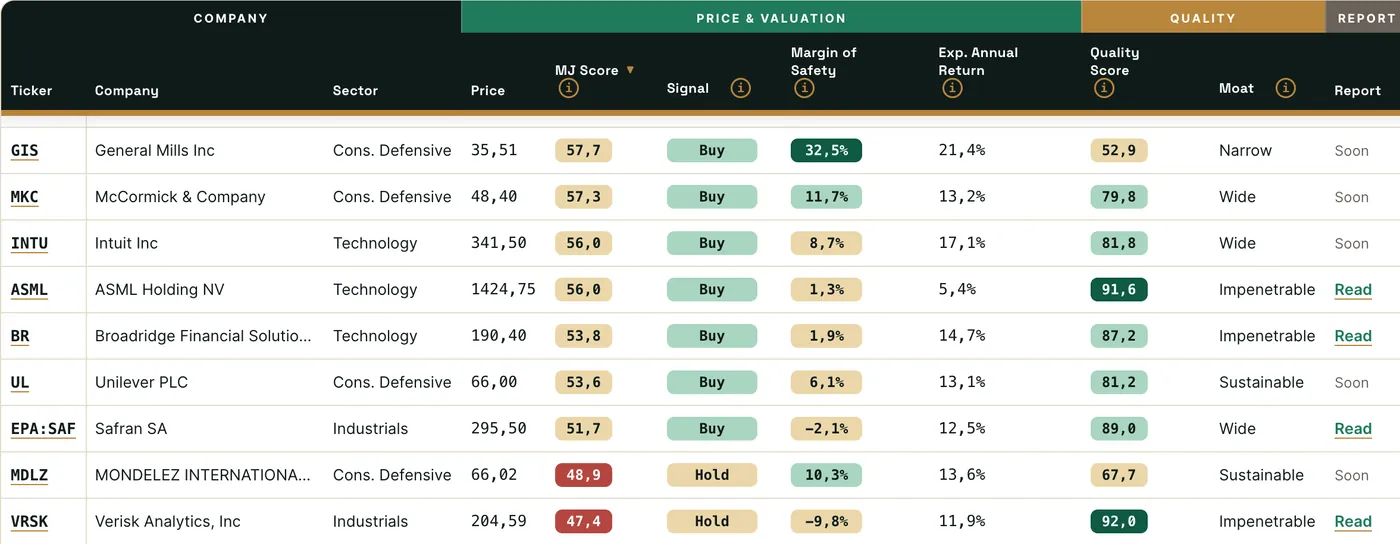
The Opportunity Matrix places every company by quality and margin of safety; the Watchlist turns it into a signal. Names of the top picks are hidden here.
How to read a signal.
- A signal says how attractive a company looks on this method today. It is not a forecast and it is not advice.
- Signals move when the price moves and when we update the fair value. A Buy can become a Hold without anything wrong with the business: the price simply rose.
- The signal is where your own work starts. Open the company, change the assumptions and see if you agree.
- The free Excel template calculates the score for you, so you can try it on any company.
What the score can get wrong.
- Fair value is an estimate. Change the assumptions and it moves, which is why every assumption is shown.
- Quality is a judgment. Two careful investors can score the same business differently.
- A score is a snapshot. It cannot see what has not happened yet.
Past performance is not a guide to future results.
Try it on a company you know.
The free Watchlist shows each company’s signal and Quality Score, except the top picks. Pro adds the margin of safety, the full MJ Score and the top picks.
MoneyJourney is educational research, not personal financial advice. Investing involves risk, including the loss of capital.