
MONEYJOURNEY RESEARCH TEMPLATE
ASML Holding NV (ASML)

QUALITY VALUE INVESTING RESEARCH
| SECTOR Technology — Semiconductor Equipment & Materials |
PRICE AT ANALYSIS $1679.92 |
MARKET CAP $647.47B |
DATE September 20, 2026 |
| FAIR VALUE $1250.14 |
MARGIN OF SAFETY -34.4% |
QUALITY SCORE 91.6 / 100 |
SIGNAL Hold |
01 — MoneyJourney Introduction
This report follows the MoneyJourney quality value investing framework: understand the business first, assess its quality and durability, calculate a reasoned estimate of intrinsic value, and only act with a margin of safety. The goal is a repeatable, transparent process — not a prediction.
A value investor might evaluate ASML due to its unmatched monopoly in extreme ultraviolet lithography, providing structural growth leverage to global semiconductor demand. Even when premium valuation multiples compress, the company’s capital-light intellectual property model and multi-year order backlogs warrant continuous monitoring for attractive entry points.
02 — The Business
What They Do & How They Make Money
Founded in 1984 as a joint venture between Philips and Advanced Semiconductor Materials International, ASML has grown into the world’s primary provider of photolithography equipment for the semiconductor industry. Headquartered in Veldhoven, Netherlands, the company designs and manufactures complex systems that use light to print microchip patterns onto silicon wafers. ASML operates principally across three revenue lines: Extreme Ultraviolet (EUV) systems, Deep Ultraviolet (DUV) systems, and Installed Base Management services. EUV lithography systems represent the cutting edge, utilizing 13.5nm wavelengths to enable the production of leading-edge logic and memory chips. DUV systems cover immersion and dry lithography technologies, servicing mature and mid-node semiconductor manufacturing requirements. Installed Base Management delivers recurring, high-margin software upgrades, system retrofits, and maintenance services for the vast operating fleet globally. Its blue-chip customer base is highly concentrated, primarily consisting of top-tier semiconductor foundries and integrated device manufacturers like TSMC, Samsung, and Intel. Geographically, revenue is heavily weighted toward Asia-Pacific chip manufacturing hubs in Taiwan, South Korea, China, and North America, functioning as an indispensable critical-path enabler for global semiconductor fabrication.
Competitive Landscape
In advanced photolithography, ASML enjoys a virtual monopoly, holding an estimated 100% market share in high-end EUV equipment where no commercial competitors exist. In the legacy and mature DUV photolithography market, ASML competes directly with Japanese manufacturers Nikon Corporation and Canon Inc. While Nikon retains a modest footprint in immersion lithography and Canon serves lower-end dry lithography markets, both lack the scale, high numerical aperture optics capabilities, and vast R&D budgets needed to challenge ASML at advanced nodes. ASML’s massive technology lead grants it immense pricing power and strong customer lock-in across the semiconductor ecosystem. Consequently, ASML’s competitive position remains extremely wide, with its market share holding firm in mature nodes and effectively unassailable in leading-edge nodes.
Revenue Breakdown
AI-estimated from general knowledge of recent public filings — approximate and may lag the latest quarter. Verify against the most recent 10-K/10-Q before publishing.
BY SEGMENT
Photolithography systems sales represent roughly 75% to 80% of total revenue, with EUV and advanced DUV systems driving the vast majority of tool shipments. The remaining approximately 20% to 25% is generated through Installed Base Management, encompassing recurring service, upgrade, and maintenance activities.
BY GEOGRAPHY
Taiwan and South Korea traditionally account for roughly 50% to 60% of total system revenues combined, driven by major foundry and memory concentration. China and North America generate approximately 20% to 25% and 10% to 15% of total sales respectively, subject to shifting global trade policy dynamics.
Competitive Advantages & Moat
- Brand Strength — Limited
- Network Effects — Limited
- Switching Costs — ASML’s deep integration into customers’ multi-billion-dollar semiconductor fab workflows creates exceptionally high switching costs, as re-tooling a foundry for alternative lithography systems would trigger exorbitant cost and yield penalties.
- Cost Advantages / Scale — Scale advantages from immense historical R&D spend and specialized supplier networks create an insurmountable cost barrier for potential new entrants attempting to replicate EUV technology.
- Regulatory / IP Protection — Extensive patent portfolios and proprietary trade secrets protect ASML’s optical lithography architectures, backed by government export control regulations that restrict foreign replication of advanced semiconductor machinery.
Risk Factors
- Geopolitical export controls and trade tensions restrict ASML’s ability to sell advanced EUV and high-end DUV systems to key international markets such as China.
- High customer concentration leaves ASML vulnerable to capital expenditure cutbacks or technology transition delays by top semiconductor manufacturers like TSMC, Intel, and Samsung.
- Supply chain bottlenecks or manufacturing execution failures in highly complex, sole-sourced components could disrupt tool deliveries and margin performance.
Bull Case
ASML holds an absolute global monopoly in EUV lithography, positioning it as an indispensable beneficiary of secular tailwinds in artificial intelligence, high-performance computing, and automotive silicon. The ramp-up of next-generation High-NA EUV tools and expanding installed-base service revenues provide high-visibility, long-term margin expansion and multi-year revenue growth. Coupled with an exceptional ROIC and pristine cash reserves, the business generates dependable, high-return organic compounding over full industry cycles.
Bear Case
At a P/E over 50x and a current price significantly above intrinsic fair value, any cyclical slowdown in chip demand or customer capex pushbacks could trigger severe valuation multiple contraction. Intensifying geopolitical export restrictions risk permanently walling off major geographic markets, placing a hard cap on system shipment volumes. Furthermore, high capital reinvestment requirements to support High-NA manufacturing could temporarily compress near-term returns on invested capital.
03 — Fundamentals
Valuation Multiples
| Market Cap ($B) | 647.47 |
| Enterprise Value ($B) | 641.08 |
| EV / EBITDA | 40.6x |
| P/E | 52.3x |
| Forward P/E | 27.6x |
| Forward Earnings Yield | 3.6% |
| P/FCF | 57.2x |
| FCF Yield | 1.7% |
Margins & Growth
| Revenue Growth (5Y) | 14.1% |
| Sales Growth YoY | 8.1% |
| Gross Margin | 52.7% |
| Operating Margin | 35.4% |
| Net Margin | 30.1% |
Balance Sheet & Returns
| Cash ($M) | 8708 |
| Long-Term Debt ($M) | 2279 |
| Net Cash ($M) | 6430 |
| Years to Pay Debt | -0.5 |
| ROE | 54.4% |
| ROIC | 66.0% |
| 5-Yr Avg ROIC | 77.7% |
Capital Returns
| Dividend Yield | 0.63% |
| Payout Ratio | 26.75% |
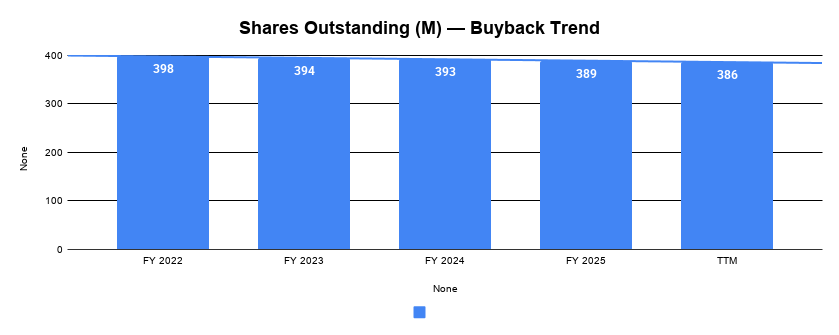
| Buybacks (Share Count Δ) | -0.8% |
| Avg. Distribution Yield | 0.8% |
What the Numbers Show
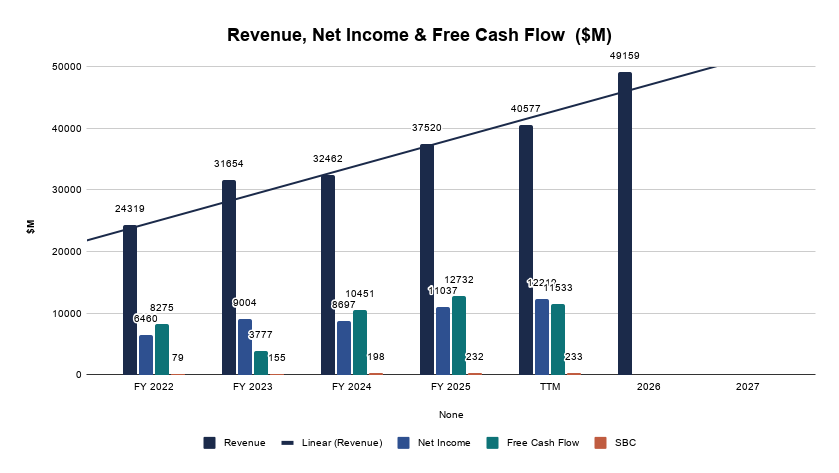
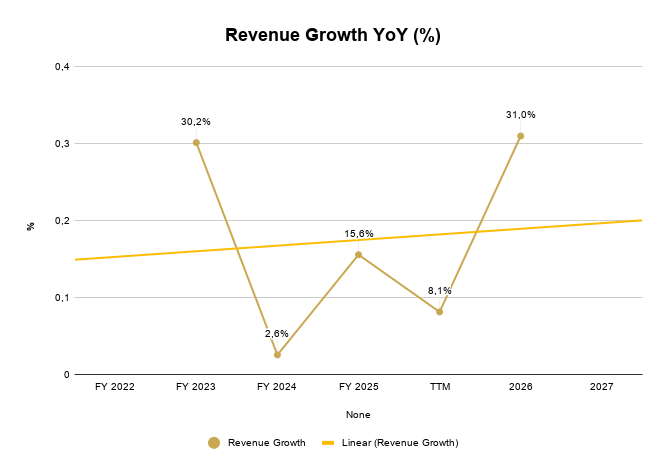
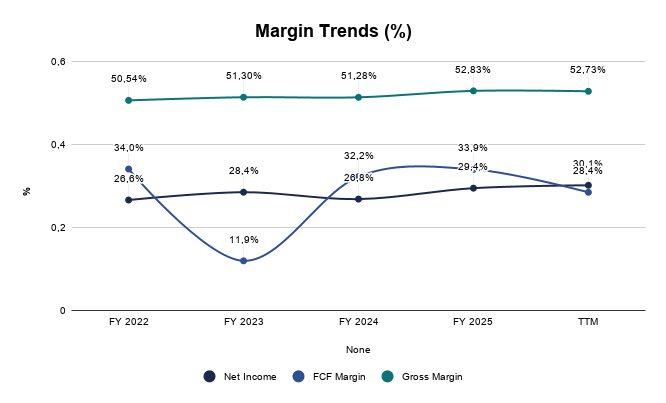
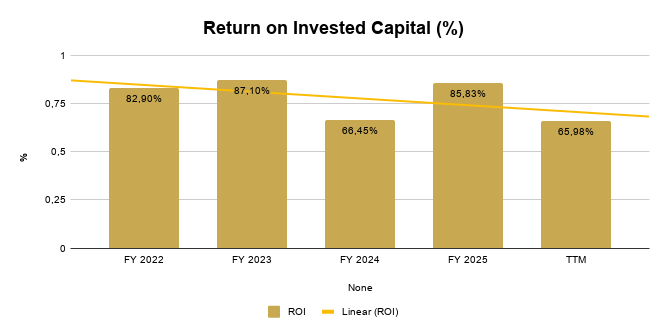
ASML exhibits exceptional capital efficiency, highlighted by a 66.0% ROIC and a 54.4% ROE, though current ROIC trails its 5-year average of 77.7% due to heavy R&D and capacity expansion reinvestments. Outstanding profitability is demonstrated through gross, operating, and net margins of 52.7%, 35.4%, and 30.1% respectively, reflecting immense pricing power across its tool portfolio. Top-line expansion remains solid with 8.1% YoY sales growth and a 14.1% 5-year CAGR, driven by organic technology adoption rather than dilutive financial leverage. The balance sheet is impeccably fortress-like, featuring a net cash position of $6,430M and negative net debt years (-0.5), providing immense financial flexibility to navigate semiconductor industry cyclicality.
5-Year Trend — Charts
Revenue, Net Income & Free Cash Flow ($M)
Revenue Growth YoY (%)
Margin Trends (%)
Return on Invested Capital (%)
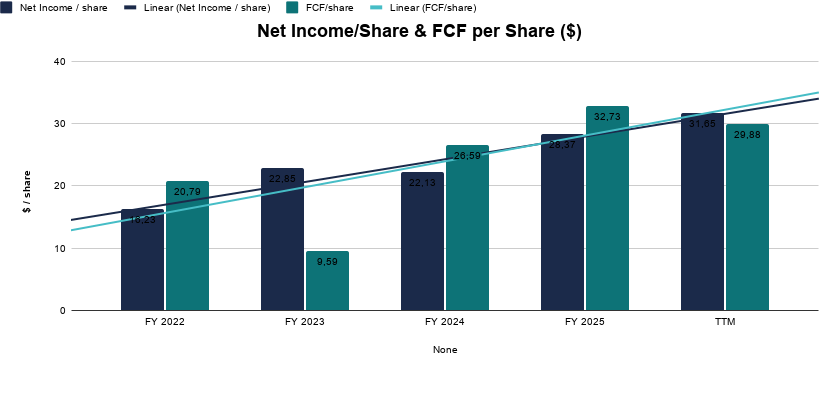
Net Income/Share & FCF per Share ($)
Shares Outstanding (M) — Buyback Trend
04 — Quality Scorecard
MoneyJourney’s 18-criteria weighted checklist — Score and Notes auto-filled from the Stock Analyzer tab.
| CRITERION | VALUE / ASSESSMENT | PASS |
| Revenue Growth | 14,1% | ✔ |
| Market Potential / Industry Growth | 38,63% | ✔ |
| Quality of Revenues | Recurring | High |
| Product / Process Development | Yes | Better |
| Research & Development | — | Better |
| High Gross Margins | 51,7% | ✔ |
| Profit Margins | 28,1% | ✔ |
| Maintaining Profit Margins | Yes | ✔ |
| Margins vs. Competition | — | Better |
| Pricing Power | Yes | ✔ |
| Debt Structure | -0,53 | Better |
| Rates of Return (ROIC / ROE) | 77,7% | ✔ |
| Management Depth | — | Extraordinary |
| Culture, Reputation & Labor Relations | — | Extraordinary |
| MOAT / Competitive Advantage | Network Effect | Impenetrable / Monopoly |
| MOAT Trend | — | Enduring |
| FCF / Share Growth | 34,5% | ✔ |
| Returns Capital (Dividends/Buybacks) | 0,8% | ✔ |
| QUALITY SCORE | — | 91.6 / 100 |
Scale: 80-100 Exceptional · 60-79 Strong · 40-59 Mixed · Below 40 Weak.
What’s Driving the Score
The score is anchored by strong marks on Rates of Return (ROIC / ROE) (10%), Pricing Power (8%), and FCF / Share Growth (8%) — three of its most heavily weighted criteria. Together, the criteria with a clear pass or fail account for roughly 45% of the total weighting — the rest sit at a middling score rather than a firm strength or weakness.
05 — Valuation
Probability-weighted DCF — auto-filled from the Valuation Model section of the Stock Analyzer tab.
Key Assumptions
| Country | Netherlands |
| Business Risk | Safe |
| Discount Rate | 10.78% |
| Revenue Growth — Base | 14.0% |
| Revenue Growth — Bull | 16.0% |
| Revenue Growth — Bear | 12.0% |
| FCF Margin (2032E) | 32.0% |
| Exit P/E Multiple (Base) | 25.0x |
Scenario Analysis
| CASE | PROB. | REV. GROWTH | EXIT P/E | INTRINSIC VALUE |
| Base Case | 60% | 14.0% | 25.0x | $1249.24 |
| Bull Case | 20% | 16.0% | 27.0x | $1559.14 |
| Bear Case | 20% | 12.0% | 23.0x | $860.80 |
Probability-Weighted Fair Value
| FAIR VALUE $1250.14 |
NET CASH / SHARE $16.61 |
MARGIN OF SAFETY -34.4% |
EXPECTED ANN. RETURN 5.4% |
What This Means
Trading at $1,679.92 against a Base Case Fair Value of $1,249.24 and even exceeding the Bull Case target of $1,559.14, ASML currently trades at a steep premium with a -34.4% margin of safety. This valuation leaves zero room for execution hiccups or cycle downturns, signaling that capital appreciation upside is severely capped at present levels.
Sensitivity Analysis
Base-case Discount Rate and Exit P/E ± one step, holding all else constant. Center cell (highlighted) matches the Base Case assumptions above — this is a single-scenario DCF sensitivity, not the same as the probability-weighted Fair Value shown above.
Intrinsic Value ($ / share)
| DISC. RATE ↓ / EXIT P/E → | 21x | 25x | 29x |
| 9.8% | 1108.03 | 1319.09 | 1530.14 |
| 10.8% | 1049.36 | 1249.24 | 1449.12 |
| 11.8% | 994.28 | 1183.66 | 1373.05 |
06 — My Take
Overall Conclusion
ASML represents a world-class economic engine, reflected in an Exceptional Quality Score of 91.6/100 driven by monopolistic technology leadership, high ROIC, and zero balance sheet stress. However, with a Hold signal and a negative margin of safety of -34.4%, current market pricing heavily discounts future growth far beyond conservative fair value parameters. The single biggest risk to this investment thesis is geopolitical restrictions and trade controls limiting equipment sales to key regions like China. While ASML is an essential asset for long-term technology exposure, disciplined value investors should wait for a meaningful price pullback toward intrinsic value before deploying fresh capital.
Investment Thesis Check
☒ Is it cheap? (Margin of safety at current price)
☑ Is it a good business? (Quality Score reflects durable fundamentals)
☐ Who is running it? (Management track record checked)
☐ What did I miss? (Deliberately looked for the counter-argument)
3 Sources of Returns
☑ Revenue / Earnings Growth
☒ P/E Expansion
☑ Buybacks and Dividends
| VERDICT HOLD |
Technical Analysis
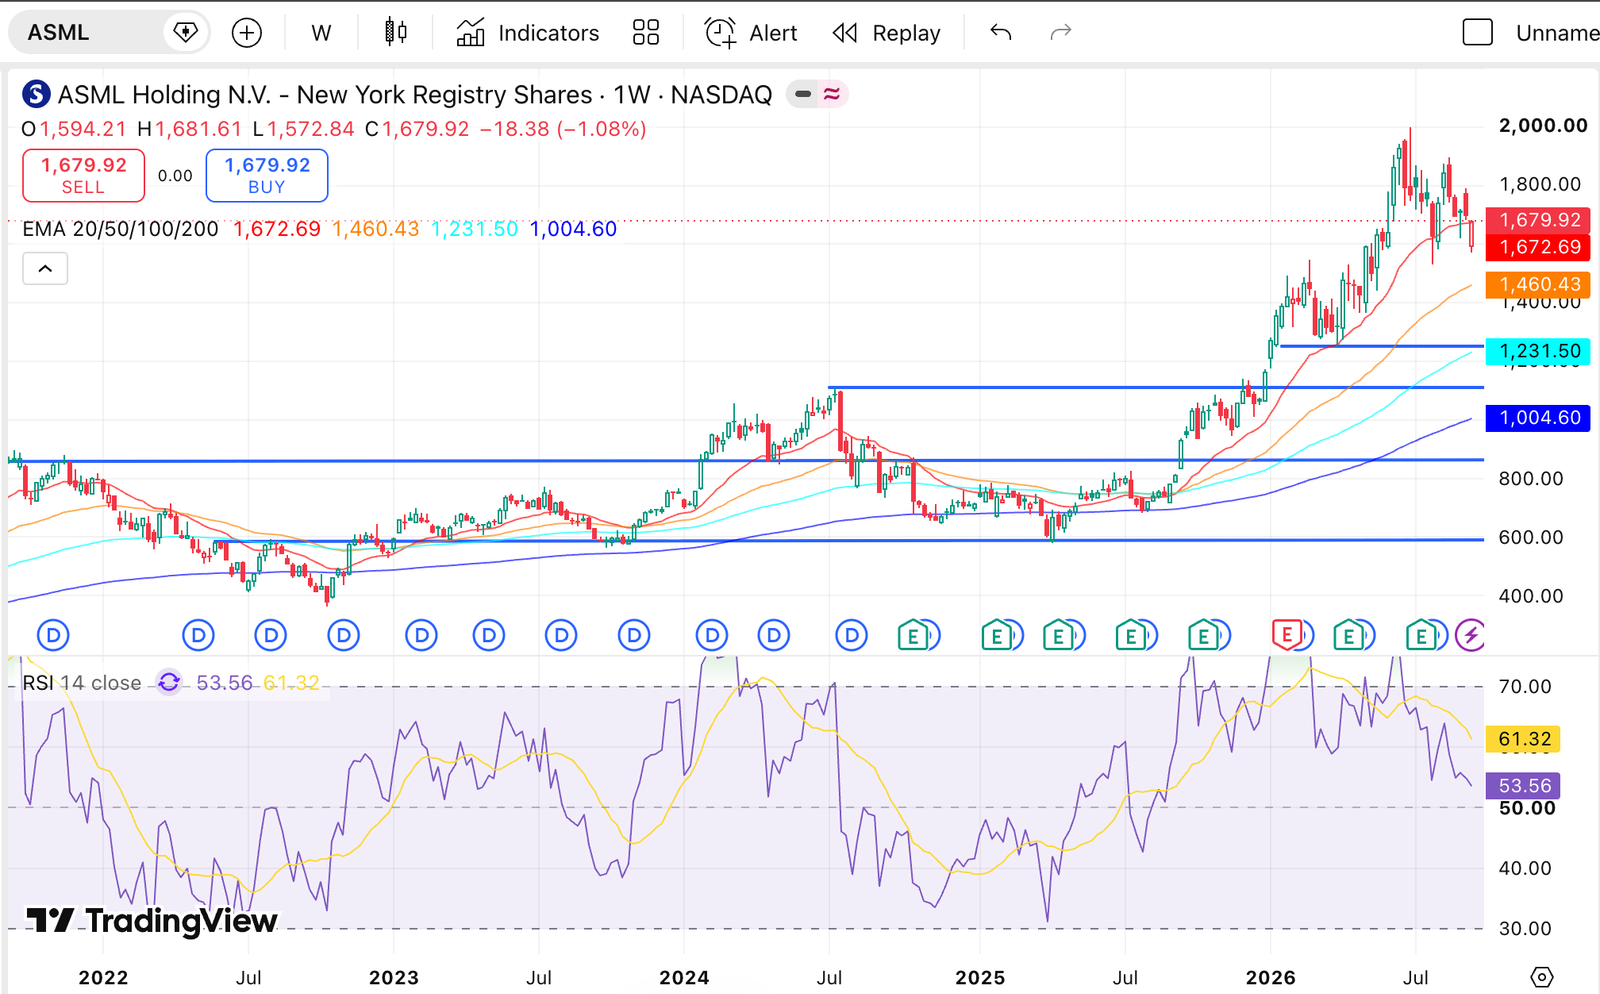
Looking from a TA perspective, we could see the 100EMA close to 1250$, which is close to our fair value for ASML stock. That level could be an initial support for the stock.
200EMA is going up and getting close to 1100$ and that could be a second support level for ASML stock.
850 and 600$ could be strong support levels based on past.
Where I’m Buying
ASML is a top high quality company, with that in mind, it will be difficult to buy ASML stock at a big discount. Fair value for me (around 1250$) is the perfect entry point to start a position. From that, my strategy would be buying as the stock price goes down, lowering my average cost.
Personal Take
ASML is in a strong position and will be a beneficiary from this big AI capex. Even without that, the exceptionalism of ASML will continue to perform exceptionally well. ASML as a company is incredible, one of the best in the world with an impenetrable moat. Their technology is brilliant and I do not see competition getting close in the next decades.
Valuation is high, but not in bubble territory. Actually, for the quality of the company and expectations of big capex spending on AI, could be actually reasonable. But i always try to be conservative, even though i´m assuming a big premium in my ASML valuation.
It’s an incredible company that I hope the stock goes down so I can have the opportunity to own it again. For now, i will maintain ASML in my watchlist.