
MONEYJOURNEY RESEARCH TEMPLATE
Symbotic Inc (SYM)

QUALITY VALUE INVESTING RESEARCH
| SECTOR Industrials — Specialty Industrial Machinery |
PRICE AT ANALYSIS $41.89 |
MARKET CAP $25.34B |
DATE September 20, 2026 |
| FAIR VALUE $10.08 |
MARGIN OF SAFETY -315.5% |
QUALITY SCORE 71.6 / 100 |
SIGNAL Sell |
01 — MoneyJourney Introduction
This report follows the MoneyJourney quality value investing framework: understand the business first, assess its quality and durability, calculate a reasoned estimate of intrinsic value, and only act with a margin of safety. The goal is a repeatable, transparent process — not a prediction.
A quality value investor might evaluate Symbotic due to its dominant technological position in supply chain automation and hyper-growth trajectory, balanced against the need to assess whether its current premium valuation reflects durable economic fundamentals.
02 — The Business
What They Do & How They Make Money
Symbotic Inc. designs, manufactures, and deploys AI-powered, end-to-end supply chain automation systems primarily for large-scale distribution centers. Founded to reimagine traditional warehousing, the company has scaled rapidly by commercializing high-density autonomous mobile robots paired with proprietary software operating systems. Its solution replaces conventional labor-intensive rack-and-aisle storage with matrixed, high-speed automated storage and retrieval systems that optimize pallet processing and freight delivery. The business generates revenue through three primary mechanisms: system deployments involving hardware and software installation, recurring software licenses, and ongoing post-implementation maintenance and operations support. Its customer base consists of major retail, wholesale, and grocery enterprise giants, with a significant concentration in anchor clients like Walmart alongside Target and C&S Wholesale Grocers. Geographically, Symbotic operates predominantly in the United States, with emerging expansion initiatives targeted at Canada and wider international markets. These business elements work in tandem, where capital-intensive hardware installations establish an entrenched physical footprint that yields high-margin software and operational service revenues over multi-year deployment cycles.
Competitive Landscape
Symbotic competes against established global industrial automation providers such as Dematic, Honeywell Intelligrated, Knapp, and Vanderlande, as well as specialized warehouse robotics firms like AutoStore. While traditional incumbents excel at bespoke conveyor and crane systems, Symbotic differentiates itself with a modular, software-centric fleet architecture that maximizes spatial density and processing throughput. Dematic and Honeywell possess larger global sales organizations and deeper historical customer relationships, but Symbotic’s specialized fleet architecture offers superior labor reduction for high-volume grocery and general merchandise distribution. However, extreme customer concentration remains a structural vulnerability relative to broader peers who enjoy diversified market share across multiple industries. Overall, Symbotic’s competitive position is holding strong in ultra-large-scale retail distribution due to its massive backlog with key anchors, though its broader industrial market expansion remains untested.
Revenue Breakdown
BY SEGMENT
Systems structure deployments represent approximately 85% to 90% of total revenue, while ongoing software licenses, maintenance, and operational services account for roughly 10% to 15%.
BY GEOGRAPHY
United States operations account for approximately 95% of total revenue, with international markets including Canada representing roughly the remaining 5%.
Competitive Advantages & Moat
- Brand Strength — Limited
- Network Effects — Limited
- Switching Costs — High switching costs stem from deeply integrated, multi-year warehouse automation deployments that are embedded into core enterprise supply chain infrastructure.
- Cost Advantages / Scale — Limited
- Regulatory / IP Protection — A strong intellectual property portfolio provides legal protection covering autonomous mobile robot hardware designs and matrixed software routing algorithms.
Risk Factors
- Severe customer concentration exposes revenue and cash flows to extreme risk if key anchor clients delay orders or alter deployment schedules.
- Failure to expand low gross margins could permanently depress return metrics like ROIC as implementation costs outpace software scaling benefits.
- Supply chain bottlenecks or deployment bottlenecks could delay revenue recognition and trigger contractual execution penalties.
Bull Case
Symbotic benefits from long-term secular tailwinds as major enterprise retailers urgently automate distribution centers to combat labor shortages and supply chain costs. Its massive net cash position of $1,746 million and multi-billion-dollar backlog provide exceptional liquidity and operational visibility to scale deployment teams. If recurring high-margin software licenses and maintenance services grow as a percentage of mix, profit margins and ROIC could expand exponentially.
Bear Case
The stock trades at an extreme valuation premium that leaves no room for operational errors, requiring multi-decade growth and margin expansion just to justify current prices. Overdependence on a small handful of key anchor clients creates an unbalanced risk profile vulnerable to client spending cuts. Furthermore, near-zero historical ROIC and paper-thin operating margins of 1.4% indicate that top-line growth has yet to generate true economic value for shareholders.
03 — Fundamentals
Valuation Multiples
| Market Cap ($B) | 25.34 |
| Enterprise Value ($B) | 24.04 |
| EV / EBITDA | 292.9x |
| P/E | 464.4x |
| Forward P/E | 112.1x |
| Forward Earnings Yield | 0.9% |
| P/FCF | 34.4x |
| FCF Yield | 2.9% |
Margins & Growth
| Revenue Growth (5Y) | 48.4% |
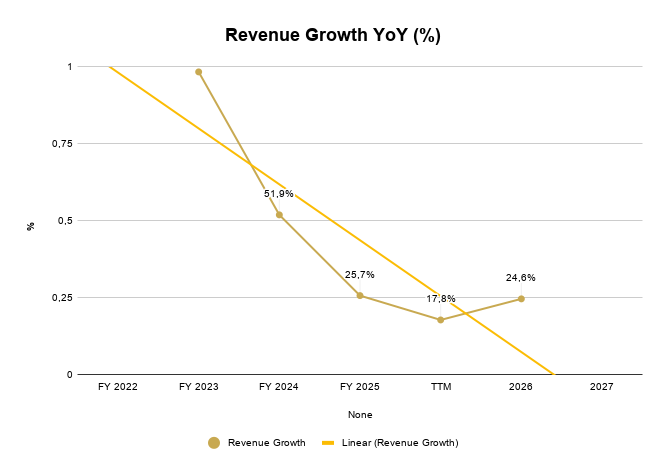
| Sales Growth YoY | 17.8% |
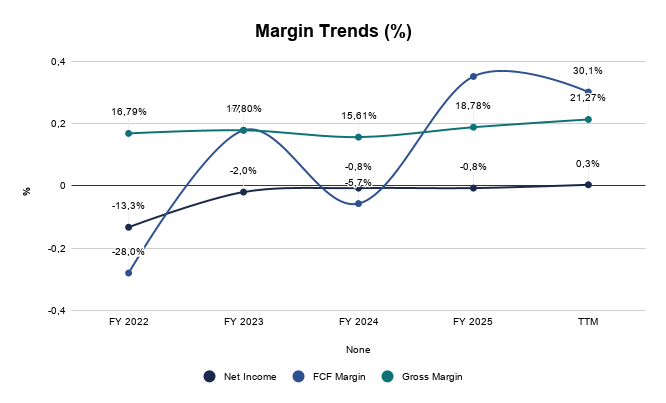
| Gross Margin | 21.3% |
| Operating Margin | 1.4% |
| Net Margin | 0.3% |
Balance Sheet & Returns
| Cash ($M) | 1746 |
| Long-Term Debt ($M) | 0 |
| Net Cash ($M) | 1746 |
| Years to Pay Debt | -212.7 |
| ROE | 2.8% |
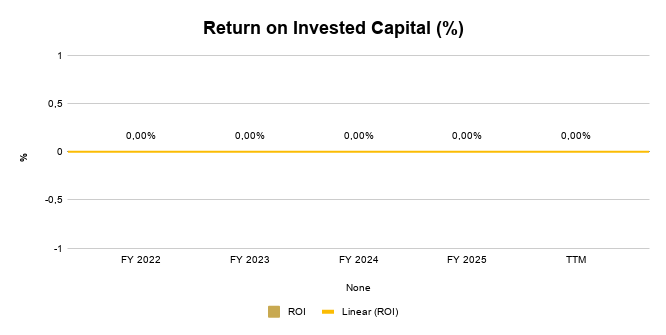
| ROIC | 0.0% |
| 5-Yr Avg ROIC | 0.0% |
Capital Returns
| Dividend Yield | —% |
| Payout Ratio | —% |
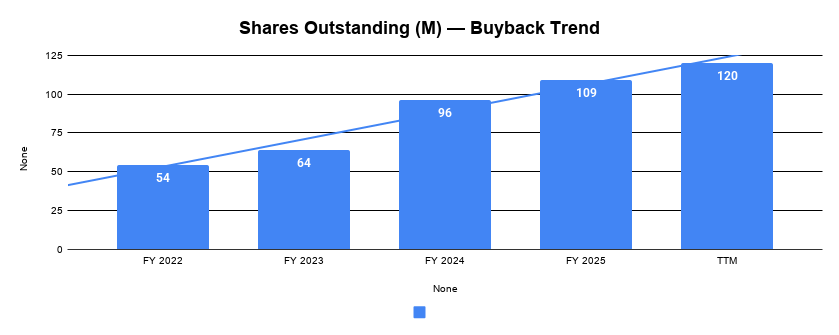
| Buybacks (Share Count Δ) | 23.0% |
| Avg. Distribution Yield | -23.0% |
What the Numbers Show
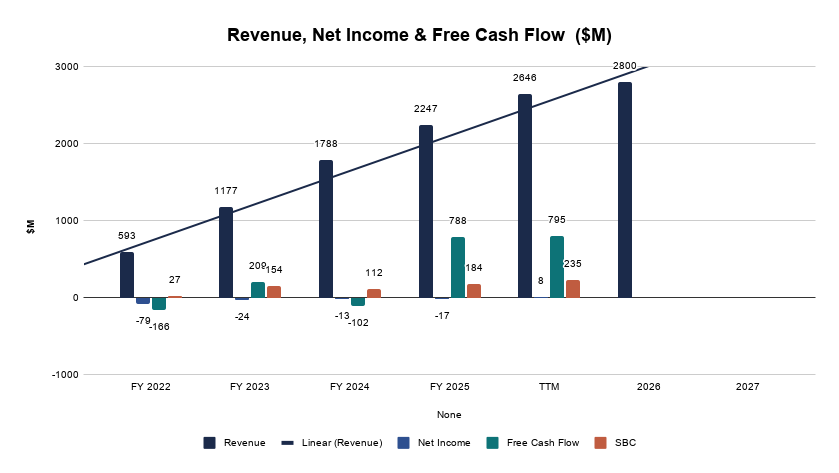
Symbotic presents a striking contrast between rapid top-line expansion and weak operational profitability, evidenced by a 5-year revenue growth rate of 48.4% paired with thin operating and net margins of 1.4% and 0.3%, respectively. Capital efficiency metrics like ROIC (0.0%) and ROE (2.8%) demonstrate that current growth has required substantial capital deployment without yet yielding meaningful economic returns. Despite low accounting margins, the balance sheet remains exceptionally strong with $1,746 million in net cash, providing a substantial runway to fund ongoing multi-year system installations. The central fundamental question is whether operating leverage will eventually expand gross margins (21.3%) into substantial net cash flows as high-margin software licensing and maintenance become a larger share of total revenue.
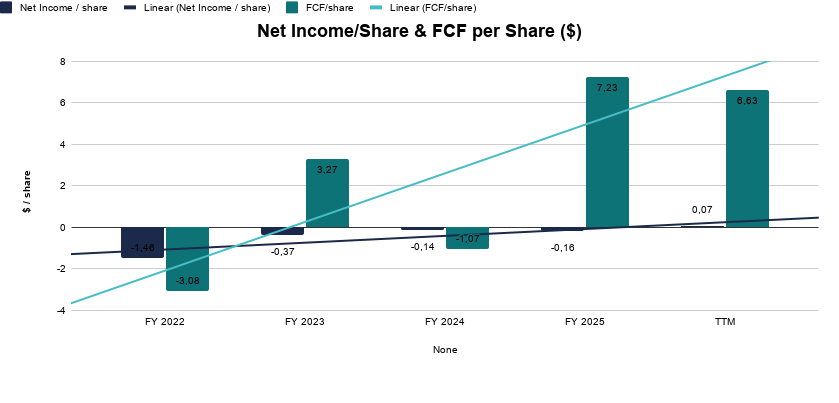
Why is Free Cash Flow (FCF) so much higher than Net Income?
It is common to see a massive disconnect between FCF and Net Income in project-based automation companies. For Symbotic, this is driven by two major accounting mechanics:
A. Massive Upfront Customer Deposits (Working Capital Dynamics)
Because Symbotic’s systems cost tens of millions of dollars and take years to deploy, they do not build them on credit. Customers (like Walmart or the GreenBox joint venture) pay massive upfront cash deposits and progress payments to fund the construction.
Cash Flow Impact: When Symbotic receives a $100 million deposit, it immediately boosts Operating Cash Flow and Free Cash Flow.
Net Income Impact: Under GAAP accounting rules, Symbotic cannot recognize that cash as “Revenue” or “Net Income” yet because they haven’t finished delivering the product. Instead, it sits on the balance sheet as a liability called Deferred Revenue or “Billings in excess of costs.” The revenue and profit are only recognized on the income statement slowly over time as the project reaches completion milestones.
B. Non-Cash Expenses (Stock-Based Compensation & Depreciation)
GAAP Net Income includes heavy non-cash deductions that do not actually cost the company physical cash in the current quarter.
Symbotic issues a significant amount of Stock-Based Compensation (SBC) to attract top-tier AI and robotics engineering talent. This severely penalizes bottom-line Net Income.
However, when calculating Free Cash Flow, accountants add non-cash expenses like SBC, depreciation, and amortization back into the cash flow statement because no money actually left the company’s bank account.
The Bottom Line: Symbotic’s high Free Cash Flow proves that the core business model is excellent at generating real-world cash upfront. The low Net Income is simply an accounting reflection of the fact that they are deferring revenue recognition for future years while currently absorbing the heavy non-cash costs of scaling the company.
5-Year Trend — Charts
Revenue, Net Income & Free Cash Flow ($M)
Revenue Growth YoY (%)
Margin Trends (%)
Return on Invested Capital (%)
Net Income/Share & FCF per Share ($)
Shares Outstanding (M) — Buyback Trend
04 — Quality Scorecard
| CRITERION | VALUE / ASSESSMENT | PASS |
| Revenue Growth | 48,4% | ✔ |
| Market Potential / Industry Growth | 54,21% | ✔ |
| Quality of Revenues | Recurring | High |
| Product / Process Development | Yes | Better |
| Research & Development | — | Better |
| High Gross Margins | 18,1% | メ |
| Profit Margins | 9,8% | ✔ |
| Maintaining Profit Margins | Yes | ✔ |
| Margins vs. Competition | — | Average |
| Pricing Power | Yes | ✔ |
| Debt Structure | -212,67 | Better |
| Rates of Return (ROIC / ROE) | 0,0% | ✔ |
| Management Depth | — | Very competent |
| Culture, Reputation & Labor Relations | — | Good |
| MOAT / Competitive Advantage | Network Effect | Sustainable |
| MOAT Trend | — | Widening |
| FCF / Share Growth | -281,1% | ✔ |
| Returns Capital (Dividends/Buybacks) | -23,0% | メ |
| QUALITY SCORE | — | 71.6 / 100 |
Scale: 80-100 Exceptional · 60-79 Strong · 40-59 Mixed · Below 40 Weak.
What’s Driving the Score
The score is anchored by strong marks on Pricing Power (8%), and FCF / Share Growth (8%) — two of its most heavily weighted criteria. On the other side, Returns Capital (Dividends/Buybacks) (4%) and High Gross Margins (3%) are the clear weak spots pulling the score down. Together, the criteria with a clear pass or fail account for roughly 45% of the total weighting — the rest sit at a middling score rather than a firm strength or weakness.
Lack of Return on Invested Capital impacted the final score. I expect SYM to have 20% plus ROI, and fundamentals will improve as the company matures.
05 — Valuation
What Margins Analyst Expects:
Expected Future / Mature Margins
Symbotic’s management has historically targeted a long-term Adjusted EBITDA margin in the 25% to 30% range, with gross margins expected to eventually settle well above 30%.
To understand how they get there from today’s razor-thin net margins, you have to look at the revenue mix shift:
The Present (Deployment Phase): Currently, the vast majority of Symbotic’s revenue comes from the initial sale and physical installation of hardware (the robots, racking, and inbound/outbound cells). This is a capital-intensive, lower-margin business (typically yielding gross margins in the high-teens to low-20s).
The Future (Recurring Phase): Once a $50 million+ system is installed, it runs for 15 to 25 years. During that lifespan, Symbotic charges recurring software licensing, maintenance, and operation fees. Software gross margins are incredibly high (often 80%+).
At maturity, once the bulk of their $22.5 billion backlog is fully deployed, the revenue mix will organically shift. Instead of 80%+ of revenue coming from low-margin hardware installations, a massive chunk will come from high-margin recurring software and services. This mix shift is the primary driver that analysts model to push long-term EBITDA margins toward that 30% target.
Wall Street analysts and Symbotic management generally target the following long-term, mature financial profile for the company in the early 2030s (roughly 7 years out):
Gross Margins: Expected to settle between 35% and 40%. As the company’s base of installed systems matures, high-margin recurring software licenses, maintenance, and operation services (often boasting 80%+ margins) will account for a much larger share of total revenue compared to the lower-margin physical hardware and installation revenue dominating today.
Operating / EBITDA Margins: Management has explicitly modeled a long-term target of 25% to 30% for Adjusted EBITDA margins. As initial deployment costs decline as a percentage of overall revenue and fixed R&D expenses are diluted over a massive global base, the business is expected to achieve significant operating leverage. Operating margins (EBIT) are generally expected to track just a few percentage points below this EBITDA target, settling in the low-to-mid 20s.
Free Cash Flow (FCF) Margins: Expected to normalize in the 20% to 25% range. While Symbotic currently generates artificially high cash flows from massive upfront customer deposits, this working capital dynamic will eventually normalize as growth moderates. At maturity, FCF will closely mirror net income, driven purely by the highly cash-generative, asset-light nature of its recurring software and services division.
Key Assumptions
| Country | United States |
| Business Risk | Low |
| Discount Rate | 12.00% |
| Revenue Growth — Base | 20.0% |
| Revenue Growth — Bull | 23.0% |
| Revenue Growth — Bear | 16.0% |
| FCF Margin (2032E) | 22.0% |
| Exit P/E Multiple (Base) | 20.0x |
Scenario Analysis
| CASE | PROB. | REV. GROWTH | EXIT P/E | INTRINSIC VALUE |
| Base Case | 60% | 20.0% | 20.0x | $6.94 |
| Bull Case | 20% | 23.0% | 25.0x | $11.25 |
| Bear Case | 20% | 16.0% | 18.0x | $3.90 |
Probability-Weighted Fair Value
| FAIR VALUE $10.08 |
NET CASH / SHARE $2.89 |
MARGIN OF SAFETY -315.5% |
EXPECTED ANN. RETURN -17.0% |
What This Means
With a current price of $41.89 far exceeding the base fair value estimate of $6.94 and even the bull case scenario of $11.25, the stock offers a deeply negative margin of safety (-315.5%) that reflects speculative pricing well ahead of intrinsic value.
Sensitivity Analysis
Base-case Discount Rate and Exit P/E ± one step, holding all else constant. Center cell (highlighted) matches the Base Case assumptions above — this is a single-scenario DCF sensitivity, not the same as the probability-weighted Fair Value shown above.
Intrinsic Value ($ / share)
| DISC. RATE ↓ / EXIT P/E → | 16x | 20x | 24x |
| 11.0% | 5.86 | 7.33 | 8.79 |
| 12.0% | 5.55 | 6.94 | 8.33 |
| 13.0% | 5.26 | 6.58 | 7.90 |
06 — My Take
Overall Conclusion
Symbotic is a strong technology innovator backed by a Quality Score of 71.6/100, reflecting proprietary robotics technology, deep customer lock-in, and a pristine net cash balance sheet. However, the market has priced in flawless operational execution and perpetual hyper-growth, resulting in an outright Sell signal with a staggering -315.5% margin of safety and a trailing P/E of 464.4x. The single biggest risk to the thesis is extreme customer concentration, where any delivery pause or capex reduction from anchor clients would severely undercut growth expectations. For value-oriented investors, while the company’s long-term automation tailwinds are real, the stock’s extreme valuation disconnect makes it uninvestable at current levels.
Investment Thesis Check
☒ Is it cheap? (Margin of safety at current price)
☑ Is it a good business? (Quality Score reflects durable fundamentals)
☐ Who is running it? (Management track record checked)
☐ What did I miss? (Deliberately looked for the counter-argument)
3 Sources of Returns
☑ Revenue / Earnings Growth
☒ P/E Expansion
☑ Buybacks and Dividends
| VERDICT SELL |
Technical Analysis
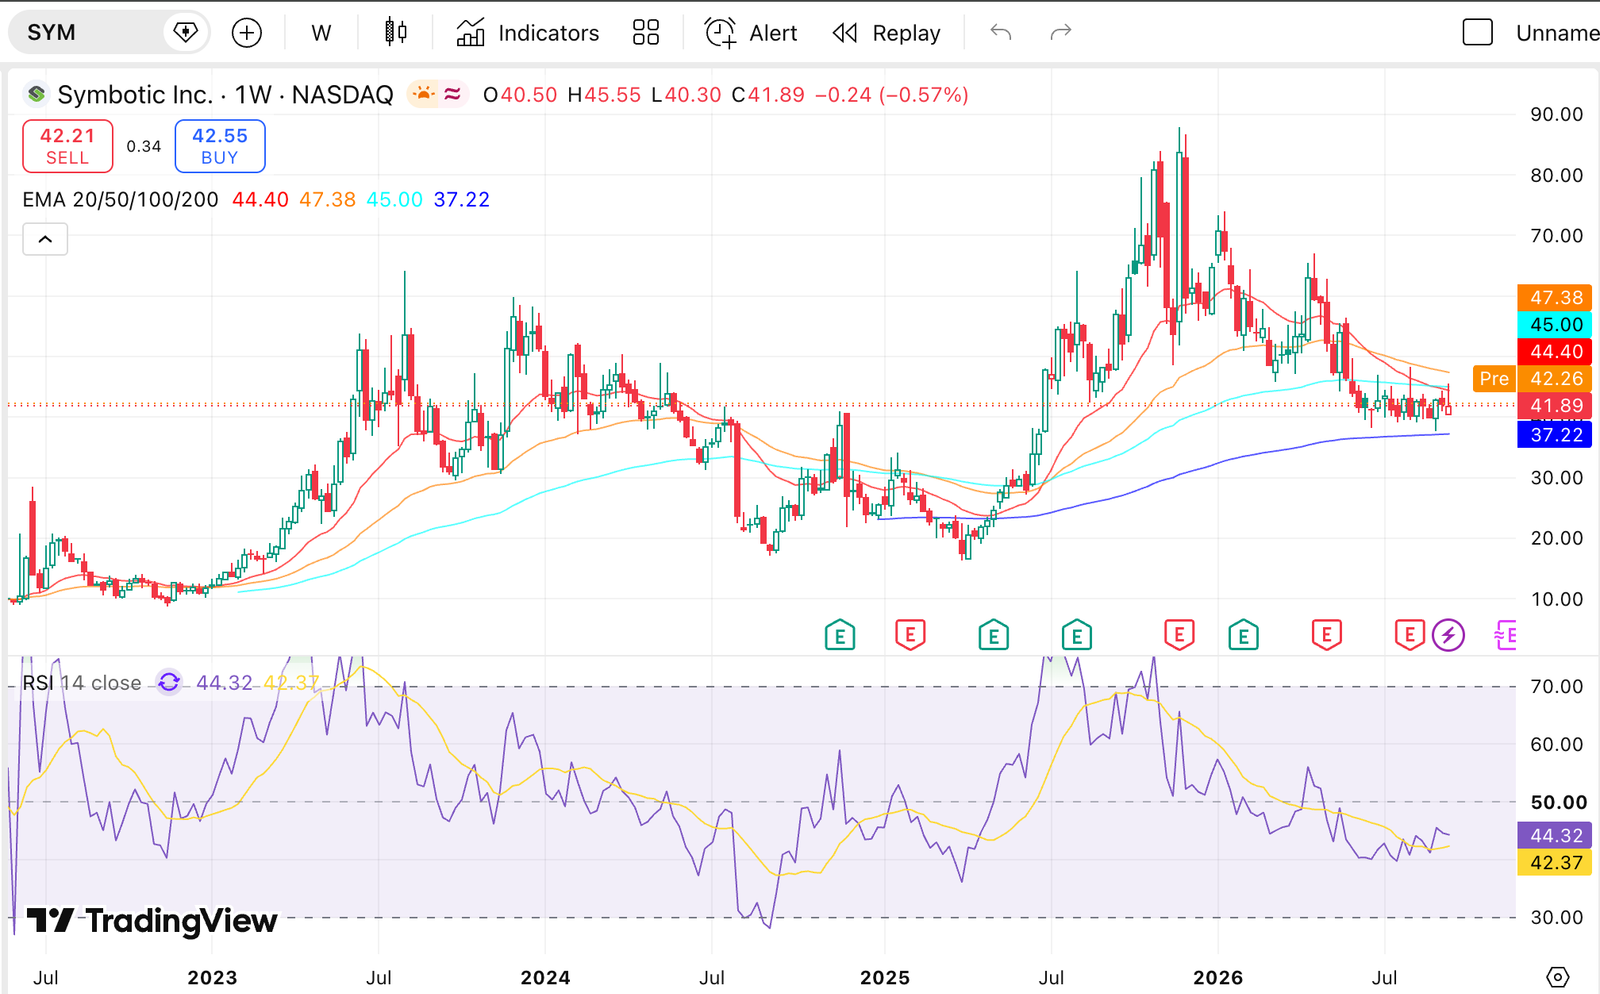
Stock is down more than 50% from ATH. Trading close to their 200EMA which could act as good support.
Personal Take
Personally I need to dig deep into Symbotic, it looks an incredible company, in their early phase of growth. A lot of potential but valuation is a big risk and there is a lot of uncertainty in their future and what they can achieve. For now, there are a lot of assumptions in their future and it´s very difficult to predict future scenarios for me.