
MONEYJOURNEY RESEARCH TEMPLATE
Stryker Corp (SYK)
QUALITY VALUE INVESTING RESEARCH
| SECTOR Healthcare — Medical Devices |
PRICE AT ANALYSIS $276.43 |
MARKET CAP $106.03B |
DATE September 8, 2026 |
| FAIR VALUE $252.78 |
MARGIN OF SAFETY -9.4% |
QUALITY SCORE 81.2 / 100 |
SIGNAL Hold |
01 — MoneyJourney Introduction
This report follows the MoneyJourney quality value investing framework: understand the business first, assess its quality and durability, calculate a reasoned estimate of intrinsic value, and only act with a margin of safety. The goal is a repeatable, transparent process — not a prediction.
Value investors may look to Stryker as a premier, high-quality medical technology compounder with high switching costs and reliable demographic tailwinds, currently trading near fair value after a period of stable operational execution.
02 — The Business
Drafted by AI from the Doc Generator script — review and edit before publishing.
What They Do & How They Make Money
Founded in 1941, Stryker Corporation is a global leader in the medical technology market, designing and manufacturing specialized medical devices and equipment. The business operates principally through two reportable segments: MedSurg & Neurotechnology, and Orthopaedics. MedSurg generates revenue through surgical equipment, patient handling technology, endoscopes, and neurosurgical instruments sold via direct sales forces to hospitals and surgical centers. Orthopaedics produces hip, knee, and trauma implants, alongside the Mako robotic-assisted surgery system, earning revenue through capital sales and high-margin surgical consumables. Stryker holds an exceptional competitive position, supported by widespread hospital integration, proprietary clinical technologies, and deep relationships with surgeon communities.
Competitive Landscape
Stryker competes primarily against large global medtech peers including Johnson & Johnson (DePuy Synthes), Zimmer Biomet, Medtronic, and Smith & Nephew. It holds market-leading positions in orthopedic robotics via its Mako platform and surgical power tools, often ranking first or second in market share across its core reconstructive and surgical categories.
Revenue Breakdown
AI-estimated from general knowledge of recent public filings — approximate and may lag the latest quarter. Verify against the most recent 10-K/10-Q before publishing.
BY SEGMENT
MedSurg and Neurotechnology represents roughly 58% of total revenue, while Orthopaedics generates approximately 42%.
BY GEOGRAPHY
The United States accounts for approximately 73% of total sales, with international markets generating the remaining roughly 27%.
Competitive Advantages & Moat
- Brand Strength — Surgeons develop deep procedural trust and preference for Stryker’s proprietary instruments over long operating careers, sustaining institutional adoption.
- Network Effects — Limited
- Switching Costs — High switching costs protect the core business, as surgeons invest hundreds of hours training on Stryker’s proprietary surgical tools and Mako robotic systems, making hospital shifts to rival ecosystems costly and disruptive.
- Cost Advantages / Scale — Extensive manufacturing scale and expansive hospital distribution networks provide significant operating efficiencies over smaller device makers.
- Regulatory / IP Protection — A dense portfolio of patents combined with rigorous FDA approval requirements creates steep barrier-to-entry walls against potential competitors.
Risk Factors
- Hospital capital spending cutbacks or deferrals of elective orthopedic procedures present the largest threat to near-term revenue momentum.
- A substantial net debt position of \$10.7 billion limits financial flexibility for aggressive bolt-on acquisitions.
- Product recall risks or regulatory hurdles on next-generation device clearances could impair brand equity and delay product launch cadences.
Bull Case
Stryker is ideally positioned to benefit from aging demographics and accelerating adoption of robotic-assisted surgery via its industry-standard Mako platform. Expanding the installed robotic base creates a recurring, high-margin consumable revenue pull-through across knee and hip procedures. Solid operating margins of 24.3% and steady top-line compounding provide predictable long-term fundamental expansion.
Bear Case
With a trailing P/E of 28.6x and recent YoY revenue growth moderating to 2.9%, current valuation multiples offer little cushion if growth slows further. Additionally, holding \$10.7 billion in net debt—requiring nearly 2.9 years to clear—exposes the company to financial leverage risks if procedure volumes encounter macro headwinds. Healthcare payor cost pressures and hospital consolidation could also weigh on gross margins over time.
03 — Fundamentals
Auto-filled from the Stock Analyzer tab via the MoneyJourney Doc Generator script.
Valuation Multiples
| Market Cap ($B) | 106.03 |
| Enterprise Value ($B) | 118.00 |
| EV / EBITDA | 15.8x |
| P/E | 28.6x |
| Forward P/E | 16.5x |
| P/FCF | 22.6x |
| FCF Yield | 4.4% |
| Forward Earnings Yield | 6.1% |
Margins & Growth
| Revenue Growth (5Y) | 8.8% |
| Sales Growth YoY | 2.9% |
| Gross Margin | 65.6% |
| Operating Margin | 24.3% |
| Net Margin | 14.4% |
Balance Sheet & Returns
| Cash ($M) | 3476 |
| Long-Term Debt ($M) | 14192 |
| Net Cash ($M) | -10716 |
| Years to Pay Debt | 2.9 |
| ROE | 16.5% |
| ROIC | 12.5% |
| 5-Yr Avg ROIC | 12.8% |
Capital Returns
| Dividend Yield | 3.53% |
| Payout Ratio | 40.48% |
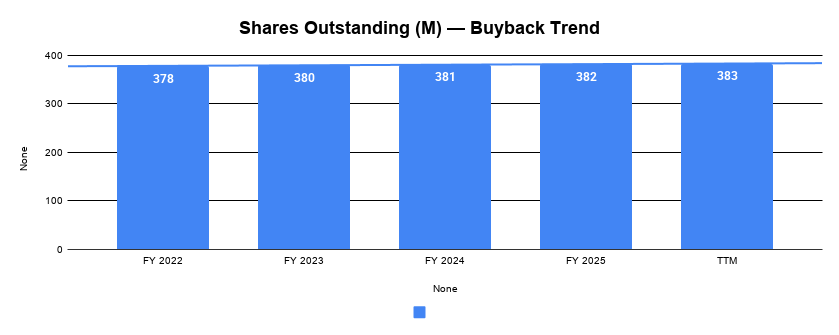
| Buybacks (Share Count Δ) | 0.3% |
| Avg. Distribution Yield | 1.0% |
What the Numbers Show
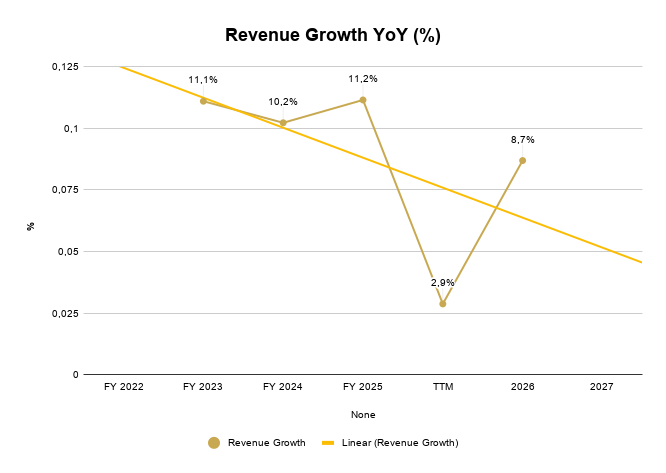
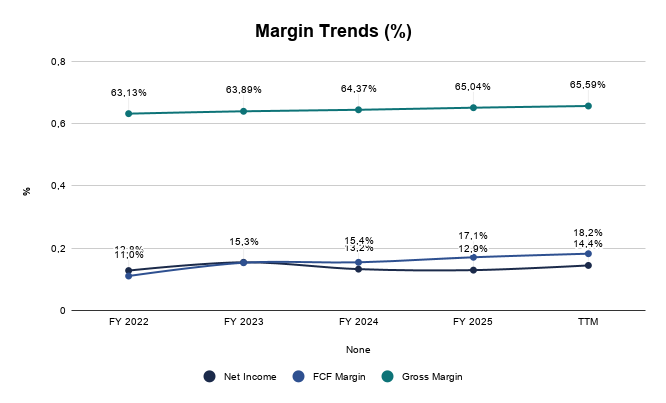
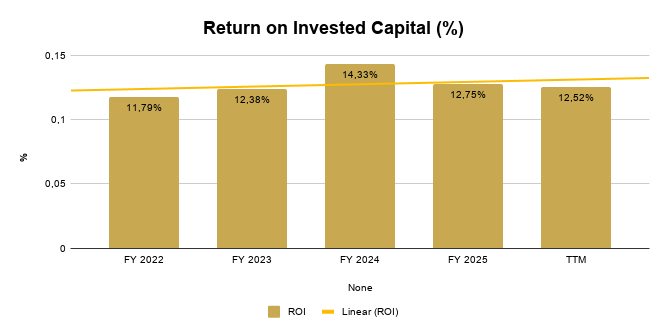
Stryker displays strong underlying profitability with 65.6% gross margins and consistent capital efficiency, demonstrated by a 12.5% ROIC that closely matches its 5-year average of 12.8%. However, a net debt load of \$10.7 billion (2.9 years to pay down) and a recent drop in YoY sales growth to 2.9% relative to its 8.8% 5-year trend signal that near-term debt management and organic volume growth bear monitoring.
5-Year Trend — Charts
Auto-inserted from the Stock Analyzer chart set by the Doc Generator script — one per row.
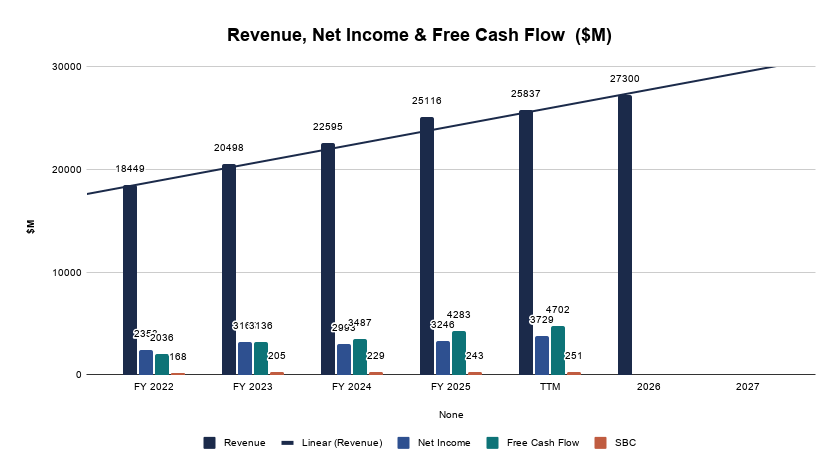
Revenue, Net Income & Free Cash Flow ($M)
Revenue Growth YoY (%)
Margin Trends (%)
Return on Invested Capital (%)
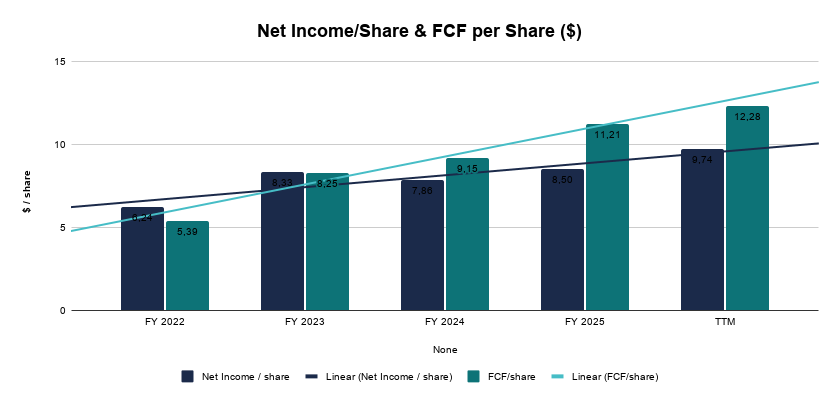
Net Income/Share & FCF per Share ($)
Shares Outstanding (M) — Buyback Trend
04 — Quality Scorecard
MoneyJourney’s 18-criteria weighted checklist — Score and Notes auto-filled from the Stock Analyzer tab.
| CRITERION | VALUE / ASSESSMENT | PASS |
| Revenue Growth | 8,8% | ✔ |
| Market Potential / Industry Growth | 11,03% | ✔ |
| Quality of Revenues | Recurring | High |
| Product / Process Development | Yes | Better |
| Research & Development | — | Better |
| High Gross Margins | 64,4% | ✔ |
| Profit Margins | 15,4% | ✔ |
| Maintaining Profit Margins | Yes | ✔ |
| Margins vs. Competition | — | Better |
| Pricing Power | Yes | ✔ |
| Debt Structure | 2,87 | Average |
| Rates of Return (ROIC / ROE) | 12,8% | ✔ |
| Management Depth | — | Extraordinary |
| Culture, Reputation & Labor Relations | — | Extraordinary |
| MOAT / Competitive Advantage | Network Effect | Wide / Formidable |
| MOAT Trend | — | Widening |
| FCF / Share Growth | 24,0% | ✔ |
| Returns Capital (Dividends/Buybacks) | 1,0% | ✔ |
| QUALITY SCORE | — | 81.2 / 100 |
Scale: 80-100 Exceptional · 60-79 Strong · 40-59 Mixed · Below 40 Weak.
What’s Driving the Score
The score is anchored by strong marks on Rates of Return (ROIC / ROE) (10%) and Pricing Power (8%) — among its most heavily weighted criteria.
05 — Valuation
Probability-weighted DCF — auto-filled from the Valuation Model section of the Stock Analyzer tab.
Key Assumptions
| Country | United States |
| Business Risk | Safe |
| Discount Rate | 9.77% |
| Revenue Growth — Base | 9.0% |
| Revenue Growth — Bull | 11.0% |
| Revenue Growth — Bear | 7.0% |
| FCF Margin (2032E) | 18.0% |
| Exit P/E Multiple (Base) | 20.0x |
Scenario Analysis
| CASE | PROB. | REV. GROWTH | EXIT P/E | INTRINSIC VALUE |
| Base Case | 60% | 9.0% | 20.0x | $250.68 |
| Bull Case | 20% | 11.0% | 22.0x | $320.85 |
| Bear Case | 20% | 7.0% | 18.0x | $190.99 |
Probability-Weighted Fair Value
| FAIR VALUE $252.78 |
NET CASH / SHARE $-27.94 |
MARGIN OF SAFETY -9.4% |
EXPECTED ANN. RETURN 8.0% |
What This Means
At \$276.43, Stryker trades at a modest premium to its \$250.68 base fair value, resulting in a -9.4% margin of safety and a conservative 8.0% expected annual return within a broad scenario range (\$190.99 bear to \$320.85 bull). The valuation relies on expected earnings expansion—reflected in the step-down from a 28.6x trailing P/E to a 16.5x forward P/E—meaning new capital has limited margin of safety at current levels.
Sensitivity Analysis
Base-case Discount Rate and Exit P/E ± one step, holding all else constant. Center cell (highlighted) matches the Base Case assumptions above — this is a single-scenario DCF sensitivity, not the same as the probability-weighted Fair Value shown above.
Intrinsic Value ($ / share)
| DISC. RATE ↓ / EXIT P/E → | 16x | 20x | 24x |
| 8.8% | 211.86 | 264.83 | 317.79 |
| 9.8% | 200.54 | 250.68 | 300.81 |
| 10.8% | 189.92 | 237.40 | 284.88 |
Margin of Safety (%)
| DISC. RATE ↓ / EXIT P/E → | 16x | 20x | 24x |
| 8.8% | -0.3% | -0.0% | 0.1% |
| 9.8% | -0.4% | -0.1% | 0.1% |
| 10.8% | -0.5% | -0.2% | 0.0% |
06 — My Take
Stryker is an exceptional, moat-protected franchise (Quality Score: 81.2/100), but at a negative margin of safety (-9.4%), it presents a classic case of a wonderful business priced slightly ahead of its immediate fair value.
Investment Thesis Check
☒ Is it cheap? (Margin of safety at current price)
☑ Is it a good business? (Quality Score reflects durable fundamentals)
☐ Who is running it? (Management track record checked)
☐ What did I miss? (Deliberately looked for the counter-argument)
3 Sources of Returns
☑ Revenue / Earnings Growth
☒ P/E Expansion
☑ Buybacks and Dividends
| VERDICT [ BUY / HOLD / WATCH / AVOID ] |
Where I’m Buying
Might like to initiate an entry position around the 280/275 level. Major support and a great business at a fair price.
Technical Analysis
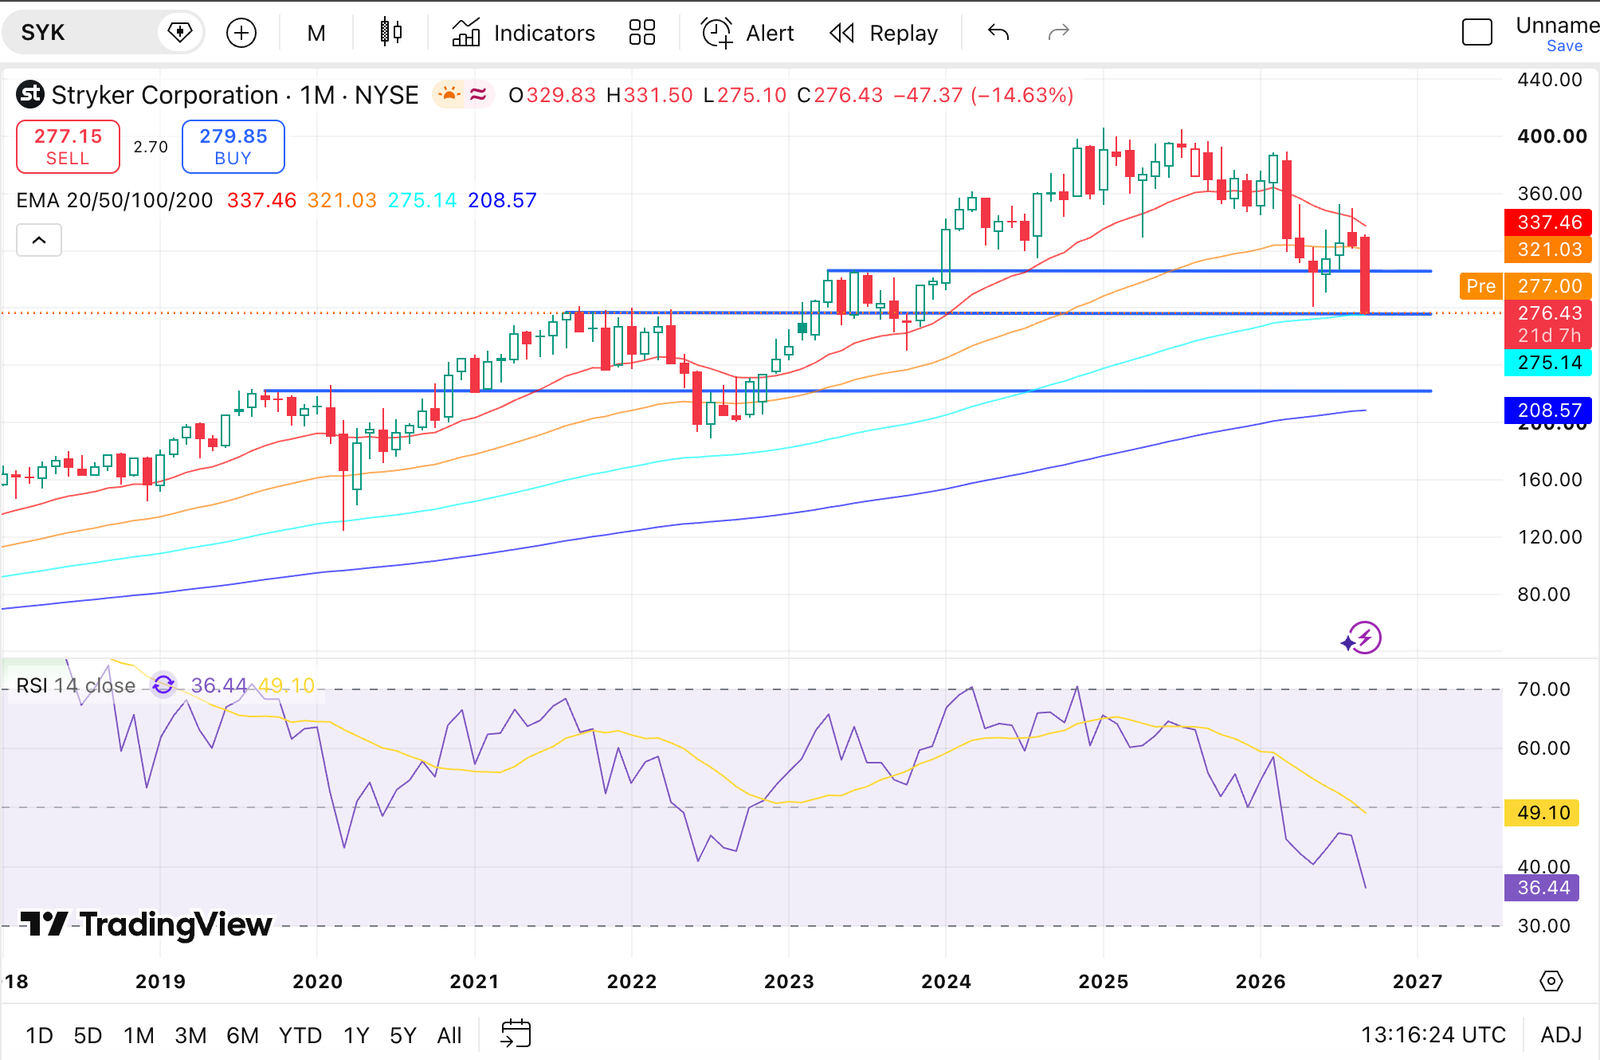
280/275 look a good entry point because of the old resistance level, and because of the support of the EMA 100.
Next major support will be around 210
Personal Take
I love the company but I need to do more research on the business. Looks like a great business at a fair price. If it´s truly a great business, it might not get cheaper. Not an incredible opportunity for a 15% annualized return, but a stable and predictable 8 to 10% return at this level.