
MONEYJOURNEY RESEARCH TEMPLATE
Airbnb Inc (ABNB)

QUALITY VALUE INVESTING RESEARCH
| SECTOR Consumer Cyclical — Travel Services |
PRICE AT ANALYSIS $151.39 |
MARKET CAP $90.65B |
DATE September 25, 2026 |
| FAIR VALUE $145.42 |
MARGIN OF SAFETY -4.1% |
QUALITY SCORE 83.6 / 100 |
SIGNAL Hold |
01 — MoneyJourney Introduction
This report follows the MoneyJourney quality value investing framework: understand the business first, assess its quality and durability, calculate a reasoned estimate of intrinsic value, and only act with a margin of safety. The goal is a repeatable, transparent process — not a prediction.
Airbnb presents a compelling profile for value-oriented quality investors due to its asset-light platform model, global category-defining brand, and high cash generation. With the stock trading near fair value following a moderation in post-pandemic growth, investors have an opportunity to evaluate a dominant compounder at a balanced price point.
02 — The Business
What They Do & How They Make Money
Airbnb Inc. operates a global online marketplace that connects hosts offering short-term accommodations and experiences with guests seeking travel stays. Founded in 2007, the company has scaled into one of the largest travel platforms worldwide, facilitating hundreds of millions of night bookings annually. Its business relies on a single platform segment that monetizes transactions by charging service fees to both hosts and guests based on total Gross Booking Value. The customer base is divided between individual and professional property hosts on one side and leisure or business travelers on the other. Geographically, Airbnb maintains a deeply international footprint spanning North America, Europe, Latin America, and Asia-Pacific. The core business model is exceptionally light on capital expenditure, as hosts supply the physical real estate while Airbnb handles payment processing, platform engineering, customer support, and brand marketing. These interconnected elements form a self-reinforcing network where expanding listing diversity attracts more global travel demand.
Competitive Landscape
Airbnb competes directly with major online travel agencies including Booking Holdings (Booking.com, Agoda) and Expedia Group (Vrbo), alongside traditional hotel chains like Marriott and Hilton. Against Booking Holdings, Airbnb holds a dominant share in unique urban and individual home listings, though Booking maintains a stronger footprint in European traditional accommodations. Vrbo competes directly in leisure vacation home rentals, but Airbnb’s broader geographic reach and density in urban markets provide superior global choice. Traditional hotel chains retain advantages in short-duration corporate travel, but Airbnb maintains strong pricing power in long-term stays and group travel. Overall, Airbnb’s market position remains firm and holding, protected by unmatched consumer brand awareness and direct platform traffic.
Revenue Breakdown
BY SEGMENT
Airbnb operates essentially as a single platform segment, with roughly 100% of revenue derived from marketplace transaction fees charged to hosts and guests.
BY GEOGRAPHY
North America represents approximately 45% to 50% of total revenue, EMEA contributes roughly 30% to 35%, while Latin America and Asia-Pacific combined make up the remaining roughly 15% to 20%.
Competitive Advantages & Moat
- Brand Strength — Airbnb possesses an iconic global consumer brand that drives a high proportion of organic direct search traffic.
- Network Effects — A powerful two-sided platform network effect links host listing diversity directly with global guest demand.
- Switching Costs — Limited
- Cost Advantages / Scale — High platform scalability allows Airbnb to spread fixed technology and marketing spend over massive booking volume.
- Regulatory / IP Protection — Limited
Risk Factors
- Increasing municipal regulations and short-term rental caps in major tourist cities could severely restrict listing inventory growth.
- A broader macroeconomic slowdown or contraction in consumer discretionary travel spending could dampen booking volumes.
- Intensified competition from legacy online travel agencies spending aggressively on marketing could pressure margins and take rates.
Bull Case
Airbnb’s category-defining global brand generates high organic traffic, allowing for exceptional cash generation without heavy reliance on paid search advertising. Unlocking new product categories, long-term stays, and expanding underpenetrated international regions offers a multi-year growth runway. A pristine balance sheet backed by $9.6 billion in net cash provides outstanding downside protection and capital return optionality.
Bear Case
Revenue growth is naturally moderating toward single digits as alternative accommodation reaches maturity in core developed markets. Escalating regulatory burdens in high-density metropolitan areas threaten both host supply and total gross booking value. At 24.2x forward P/E with moderating top-line expansion, the stock offers negligible margin of safety against potential consumer spending weakness.
03 — Fundamentals
Valuation Multiples
| Market Cap ($B) | 90.65 |
| Enterprise Value ($B) | 81.01 |
| EV / EBITDA | 28.0x |
| P/E | 34.4x |
| Forward P/E | 24.2x |
| Forward Earnings Yield | 4.1% |
| P/FCF | 18.7x |
| FCF Yield | 5.4% |
Margins & Growth
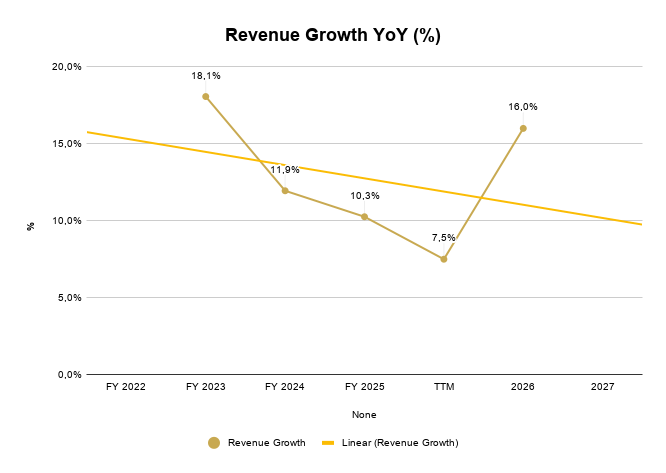
| Revenue Growth (5Y) | 11.9% |
| Sales Growth YoY | 7.5% |
| Gross Margin | 82.9% |
| Operating Margin | 21.2% |
| Net Margin | 20.4% |
Balance Sheet & Returns
| Cash ($M) | 12069 |
| Long-Term Debt ($M) | 2476 |
| Net Cash ($M) | 9593 |
| Years to Pay Debt | -3.6 |
| ROE | 34.5% |
| ROIC | 26.2% |
| 5-Yr Avg ROIC | 40.6% |
Capital Returns
| Dividend Yield | —% |
| Payout Ratio | 0.00% |
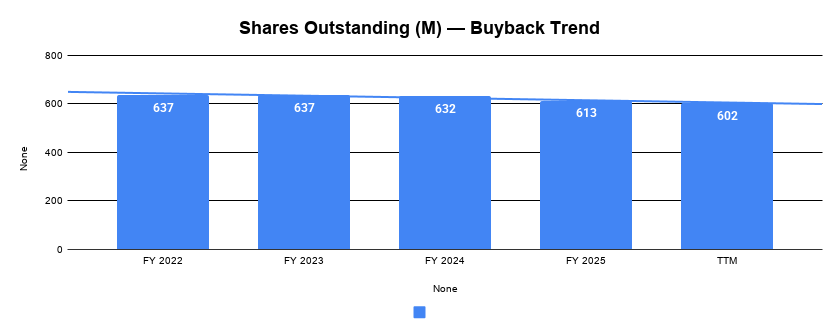
| Buybacks (Share Count Δ) | -1.4% |
| Avg. Distribution Yield | 1.4% |
What the Numbers Show
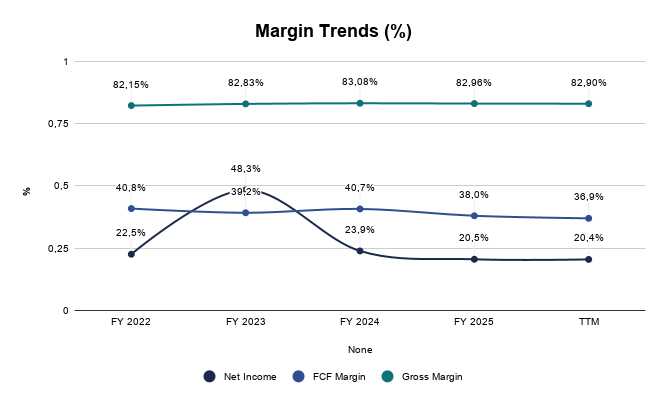
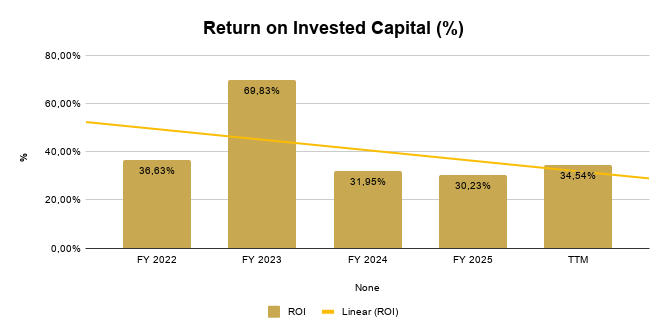
Airbnb demonstrates elite asset-light profitability, highlighted by an 82.9% gross margin and a 20.4% net margin. While top-line expansion has slowed from a 11.9% 5-year average to 7.5% YoY, capital efficiency remains stellar with an ROE of 34.5% and ROIC of 26.2%, though ROIC has moderated from its historical 5-year average of 40.6%. The business converts profits into cash efficiently, delivering a solid 5.4% free cash flow yield. Furthermore, a massive balance sheet reserve of $9,593 million in net cash provides operational resilience and significant capacity for share repurchases.
5-Year Trend — Charts
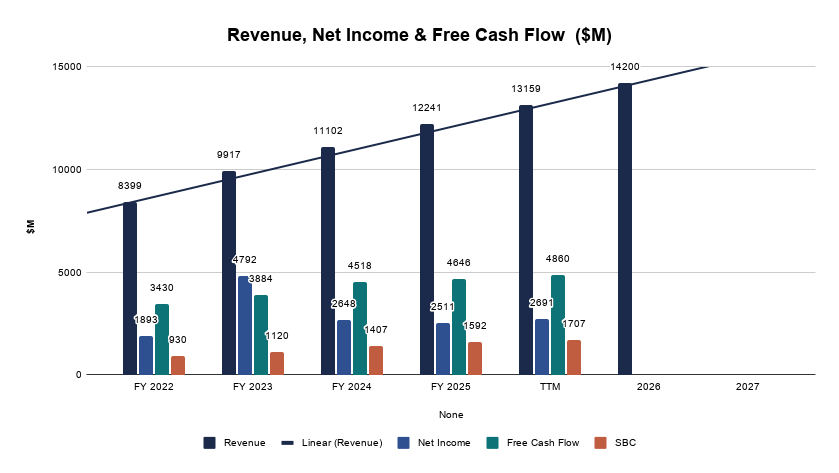
Revenue, Net Income & Free Cash Flow ($M)
Revenue Growth YoY (%)
Margin Trends (%)
Return on Invested Capital (%)
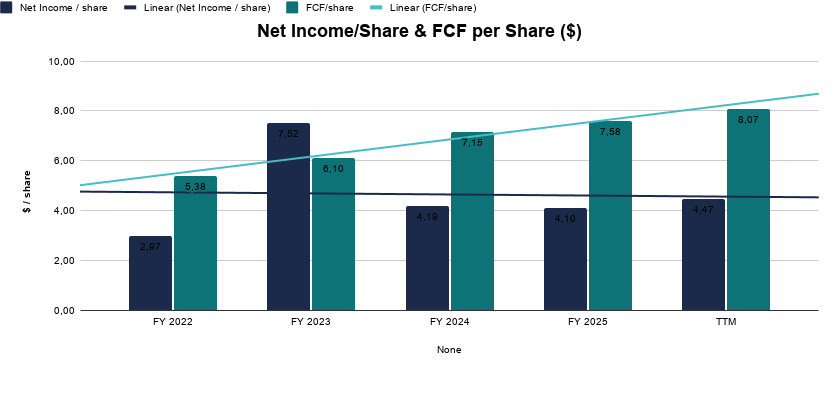
Net Income/Share & FCF per Share ($)
Shares Outstanding (M) — Buyback Trend
04 — Quality Scorecard
MoneyJourney’s 18-criteria weighted checklist — Score and Notes auto-filled from the Stock Analyzer tab.
| CRITERION | VALUE / ASSESSMENT | PASS |
| Revenue Growth | 11,9% | ✔ |
| Market Potential / Industry Growth | 22,80% | ✔ |
| Quality of Revenues | Consumer Based | Medium |
| Product / Process Development | Yes | Better |
| Research & Development | — | Better |
| High Gross Margins | 82,8% | ✔ |
| Profit Margins | 39,1% | ✔ |
| Maintaining Profit Margins | Yes | ✔ |
| Margins vs. Competition | — | Better |
| Pricing Power | Yes | ✔ |
| Debt Structure | -3,56 | Better |
| Rates of Return (ROIC / ROE) | 40,6% | ✔ |
| Management Depth | — | Very competent |
| Culture, Reputation & Labor Relations | — | Average |
| MOAT / Competitive Advantage | Network Effect | Wide / Formidable |
| MOAT Trend | — | Enduring |
| FCF / Share Growth | 10,8% | ✔ |
| Returns Capital (Dividends/Buybacks) | 1,4% | ✔ |
| QUALITY SCORE | — | 83.6 / 100 |
Scale: 80-100 Exceptional · 60-79 Strong · 40-59 Mixed · Below 40 Weak.
What’s Driving the Score
The score is anchored by strong marks on Rates of Return (ROIC / ROE) (10%), Pricing Power (8%), and FCF / Share Growth (8%) — three of its most heavily weighted criteria. Together, the criteria with a clear pass or fail account for roughly 45% of the total weighting — the rest sit at a middling score rather than a firm strength or weakness.
Want the full DCF model for this analysis?
Download the exact Excel Valuation Template I used to calculate these numbers.
05 — Valuation
Key Assumptions
| Country | United States |
| Business Risk | Low |
| Discount Rate | 12.72% |
| Revenue Growth — Base | 11.0% |
| Revenue Growth — Bull | 13.0% |
| Revenue Growth — Bear | 9.0% |
| FCF Margin (2032E) | 36.0% |
| Exit P/E Multiple (Base) | 20.0x |
Scenario Analysis
| CASE | PROB. | REV. GROWTH | EXIT P/E | INTRINSIC VALUE |
| Base Case | 60% | 11.0% | 20.0x | $128.83 |
| Bull Case | 20% | 13.0% | 22.0x | $163.64 |
| Bear Case | 20% | 9.0% | 18.0x | $95.63 |
Probability-Weighted Fair Value
| FAIR VALUE $145.42 |
NET CASH / SHARE $16.27 |
MARGIN OF SAFETY -4.1% |
EXPECTED ANN. RETURN 9.7% |
What This Means
Trading at $151.39 compared to a calculated Fair Value of $145.42 (-4.1% Margin of Safety), the stock sits between its Base ($128.83) and Bull ($163.64) scenario values. This tight alignment suggests the market is pricing current earnings accurately, leaving minimal margin of safety for value-focused entry.
Sensitivity Analysis
Base-case Discount Rate and Exit P/E ± one step, holding all else constant. Center cell (highlighted) matches the Base Case assumptions above — this is a single-scenario DCF sensitivity, not the same as the probability-weighted Fair Value shown above.
Intrinsic Value ($ / share)
| DISC. RATE ↓ / EXIT P/E → | 16x | 20x | 24x |
| 11.7% | 108.72 | 135.90 | 163.08 |
| 12.7% | 103.06 | 128.83 | 154.59 |
| 13.7% | 97.74 | 122.18 | 146.62 |
06 — My Take
Overall Conclusion
Airbnb is an exceptional business, evidenced by its 83.6/100 Quality Score, elite returns on capital, and strong balance sheet liquidity. However, the current valuation fully reflects these operational strengths, as a -4.1% Margin of Safety and a Hold signal indicate limited upside to intrinsic value at $151.39. The single largest threat to the investment thesis remains localized municipal regulations restricting short-term rental supply in major global markets. While the business model is top-tier, disciplined value investors should wait for a pullback toward the $128.83 base-case level before allocating capital.
Investment Thesis Check
☒ Is it cheap? (Margin of safety at current price)
☑ Is it a good business? (Quality Score reflects durable fundamentals)
☐ Who is running it? (Management track record checked)
☐ What did I miss? (Deliberately looked for the counter-argument)
3 Sources of Returns
☑ Revenue / Earnings Growth
☒ P/E Expansion
☑ Buybacks and Dividends
| VERDICT HOLD |
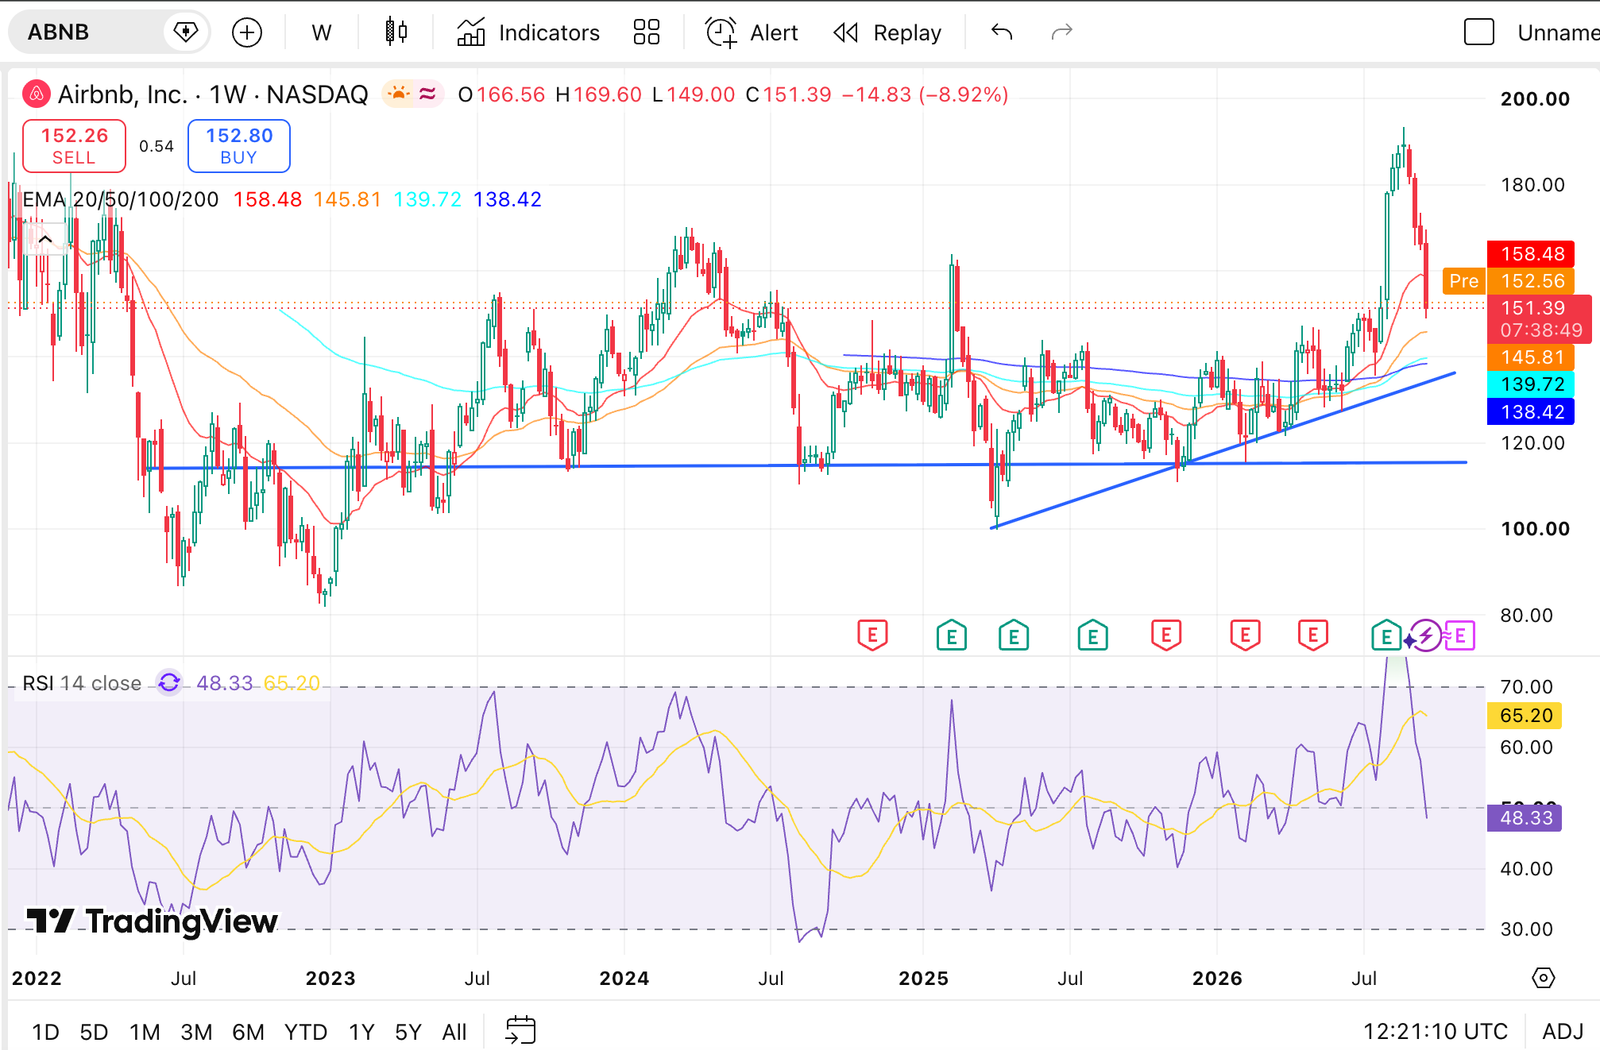
Technical Analysis
Personal Take
Honestly, every time I looked into this industry, I liked Airbnb but I always preferred the Booking business. Because of that I’ve ignored ABNB stock for a long time. Most recently with development on AI and agents capabilities, I believe ABNB is more protected from this risk than Booking for example.
Analysing ABNB stock, I believe we have an exceptional business, trading close to their fair value. At this level, the risk/reward is positive for investors. In my opinion this is close to a buying opportunity, to get an entry position.
For me personally, I would need a bigger margin of safety to invest in ABNB. I will continue to watch ABNB stock closely and if it drops to 120/115$ level, I will dig deep again and evaluate this possible investment.