
MONEYJOURNEY RESEARCH TEMPLATE
Booking Holdings Inc (BKNG)

QUALITY VALUE INVESTING RESEARCH
| SECTOR Consumer Cyclical — Travel Services |
PRICE AT ANALYSIS $157.41 |
MARKET CAP $118.27B |
DATE September 25, 2026 |
| FAIR VALUE $251.22 |
MARGIN OF SAFETY 37.3% |
QUALITY SCORE 90.2 / 100 |
SIGNAL Good Buy |
01 — MoneyJourney Introduction
This report follows the MoneyJourney quality value investing framework: understand the business first, assess its quality and durability, calculate a reasoned estimate of intrinsic value, and only act with a margin of safety. The goal is a repeatable, transparent process — not a prediction.
Value investors may find Booking Holdings compelling due to its rare combination of capital-light operations, dominant global online travel agency positioning, and an attractive valuation offering an elevated free cash flow yield.
02 — The Business
What They Do & How They Make Money
Booking Holdings Inc. is the world’s leading provider of online travel and related services, originally founded as Priceline.com before acquiring European powerhouse Booking.com, which now drives the vast majority of consolidated earnings. The business operates primarily through major consumer-facing brands including Booking.com, Priceline, Agoda, KAYAK, and OpenTable. Revenue is generated predominantly via commission fees from accommodations, flight bookings, and rental cars, utilizing both agency models where travel providers collect payment directly and merchant models where Booking processes customer payments. Booking.com dominates international travel bookings, particularly across Europe and Asia, while Priceline focuses heavily on North American discount travel. Agoda serves as a regional leader across Asia-Pacific, while KAYAK provides metasearch capabilities and OpenTable powers restaurant reservation systems. Serving hundreds of millions of individual travelers and millions of property partners globally, the company operates in over 220 countries and territories. Together, these distinct travel services form an integrated global platform that benefits from cross-promotional synergies, massive aggregate demand, and centralized technology infrastructure.
Competitive Landscape
Booking Holdings competes directly with Expedia Group in North American and international OTA markets, Airbnb in alternative accommodations, and Google Travel in top-of-funnel customer acquisition. Against Expedia, Booking maintains superior operating margins and a dominant European footprint, keeping its market share trajectory strengthening in international markets. Compared to Airbnb, Booking is rapidly expanding its alternative accommodation listings while offering a broader selection of traditional hotels on a single platform. Google represents a constant competitive threat by capturing user intent at search, but Booking’s massive performance marketing spend and direct traffic initiatives allow it to defend its market presence effectively. Overall, Booking’s competitive position remains exceptionally strong and continues to hold or strengthen relative to traditional OTA peers due to superior efficiency and network scale.
Revenue Breakdown
BY SEGMENT
Merchant revenues generate approximately 50% to 55% of total revenue, agency revenues account for roughly 40% to 45%, and advertising and other revenues represent approximately 5% to 10%.
BY GEOGRAPHY
International operations, led primarily by Europe and Asia-Pacific, generate approximately 85% to 90% of total revenue, with the domestic United States market contributing roughly 10% to 15%.
Competitive Advantages & Moat
- Brand Strength — Booking.com and its sibling brands maintain high global consumer recall, though performance marketing remains necessary to capture initial search traffic.
- Network Effects — The business benefits from a powerful two-sided network effect where a massive global inventory of properties attracts travelers, which in turn attracts more accommodation listings.
- Switching Costs — Limited
- Cost Advantages / Scale — Massive booking volume provides unmatched marketing spend efficiency and fixed technology platform leverage over smaller competitors.
- Regulatory / IP Protection — Limited
Risk Factors
- Disintermediation or increased customer acquisition costs driven by Google’s dominant search position and expanding travel search tools.
- Global macroeconomic weakness or geopolitical tensions causing widespread reductions in consumer and business travel spending.
- Regulatory scrutiny in key markets such as the European Union regarding platform dominance, parity clauses, and consumer transparency.
Bull Case
Booking continues to expand its alternative accommodation supply while growing its direct app traffic, lowering customer acquisition costs and driving operating margins higher. Combined with high capital efficiency and a generous free cash flow yield, disciplined share repurchases can compound shareholder returns rapidly.
Bear Case
Escalating customer acquisition costs via search engines and meta-search platforms compress net margins over time. Meanwhile, increased competition from specialized travel platforms and direct hotel booking initiatives could slow top-line growth.
03 — Fundamentals
Valuation Multiples
| Market Cap ($B) | 118.27 |
| Enterprise Value ($B) | 121.46 |
| EV / EBITDA | 11.4x |
| P/E | 17.4x |
| Forward P/E | 12.7x |
| Forward Earnings Yield | 7.9% |
| P/FCF | 12.4x |
| FCF Yield | 8.1% |
Margins & Growth
| Revenue Growth (5Y) | 13.6% |
| Sales Growth YoY | 4.9% |
| Gross Margin | 87.2% |
| Operating Margin | 35.2% |
| Net Margin | 25.5% |
Balance Sheet & Returns
| Cash ($M) | 17214 |
| Long-Term Debt ($M) | 18180 |
| Net Cash ($M) | -966 |
| Years to Pay Debt | 0.1 |
| ROE | —% |
| ROIC | 92.5% |
| 5-Yr Avg ROIC | 69.1% |
Capital Returns
| Dividend Yield | 0.97% |
| Payout Ratio | 23.19% |
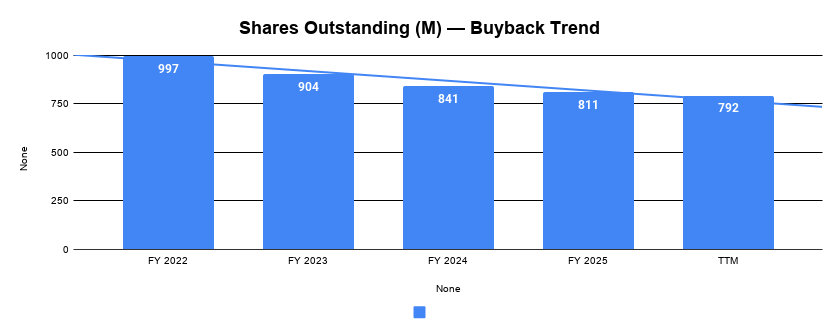
| Buybacks (Share Count Δ) | -5.6% |
| Avg. Distribution Yield | 5.6% |
What the Numbers Show
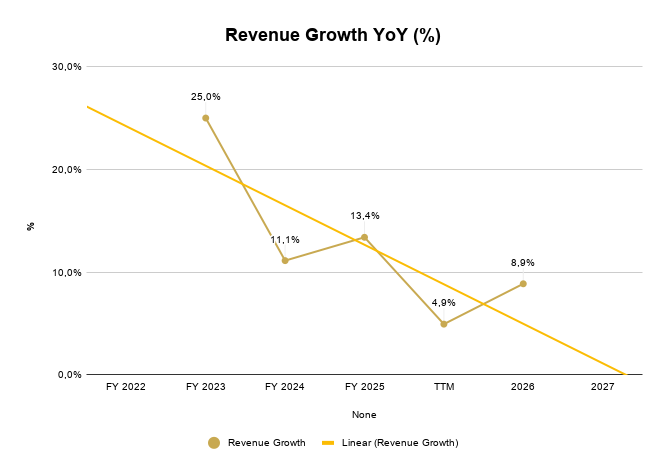
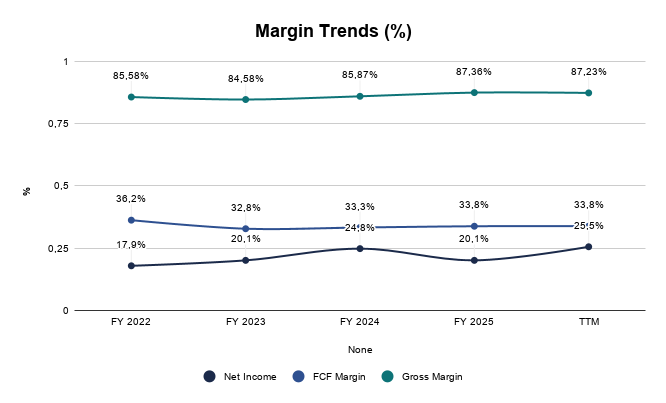
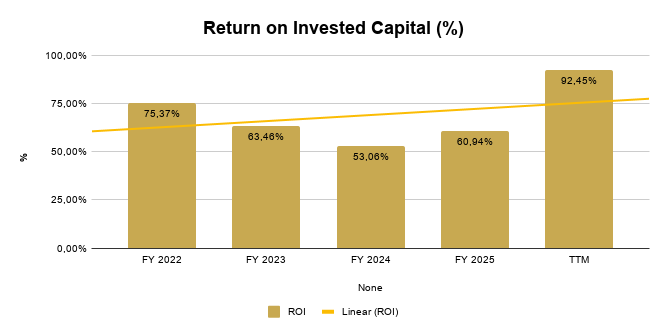
Booking demonstrates elite operational efficiency with an extraordinary ROIC of 92.5%, significantly above its already impressive 5-year average of 69.1%, driven by its capital-light agency model. Gross margins of 87.2% and operating margins of 35.2% underscore massive pricing power and cost discipline, even as YoY sales growth moderates to 4.9% relative to its 13.6% 5-year annualized trend. The company converts high earnings into substantial cash flow, supporting an 8.1% FCF yield while maintaining a pristine balance sheet where net debt of $966 million can be covered in just 0.1 years of cash flow. This financial profile confirms that growth is generated organically without excessive capital consumption.
5-Year Trend — Charts
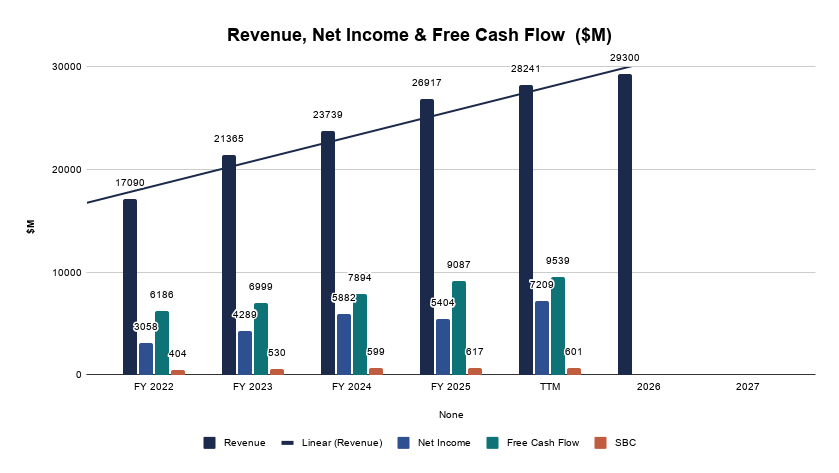
Revenue, Net Income & Free Cash Flow ($M)
Revenue Growth YoY (%)
Margin Trends (%)
Return on Invested Capital (%)
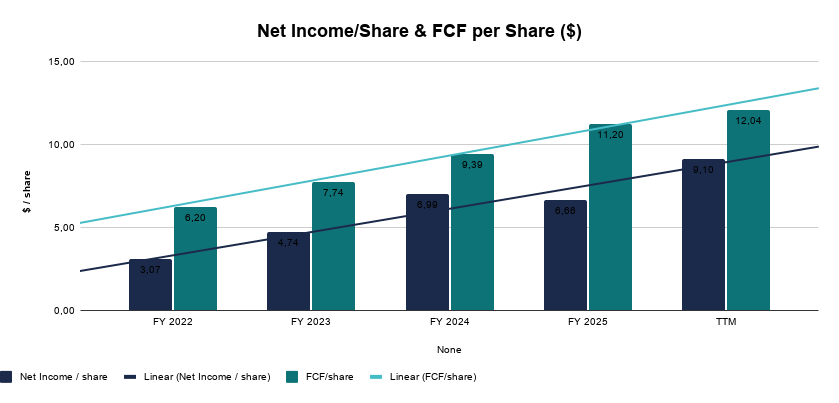
Net Income/Share & FCF per Share ($)
Shares Outstanding (M) — Buyback Trend
04 — Quality Scorecard
MoneyJourney’s 18-criteria weighted checklist — Score and Notes auto-filled from the Stock Analyzer tab.
| CRITERION | VALUE / ASSESSMENT | PASS |
| Revenue Growth | 13,6% | ✔ |
| Market Potential / Industry Growth | 16,23% | ✔ |
| Quality of Revenues | Consumer Based | Medium |
| Product / Process Development | Yes | Better |
| Research & Development | — | Better |
| High Gross Margins | 86,1% | ✔ |
| Profit Margins | 33,9% | ✔ |
| Maintaining Profit Margins | Yes | ✔ |
| Margins vs. Competition | — | Better |
| Pricing Power | Yes | ✔ |
| Debt Structure | 0,13 | Better |
| Rates of Return (ROIC / ROE) | 69,1% | ✔ |
| Management Depth | — | Extraordinary |
| Culture, Reputation & Labor Relations | — | Good |
| MOAT / Competitive Advantage | Network Effect | Wide / Formidable |
| MOAT Trend | — | Enduring |
| FCF / Share Growth | 18,2% | ✔ |
| Returns Capital (Dividends/Buybacks) | 5,6% | ✔ |
| QUALITY SCORE | — | 90.2 / 100 |
Scale: 80-100 Exceptional · 60-79 Strong · 40-59 Mixed · Below 40 Weak.
What’s Driving the Score
The score is anchored by strong marks on Rates of Return (ROIC / ROE) (10%), Pricing Power (8%), and FCF / Share Growth (8%) — three of its most heavily weighted criteria. Together, the criteria with a clear pass or fail account for roughly 45% of the total weighting — the rest sit at a middling score rather than a firm strength or weakness.
Want the full DCF model for this analysis?
Download the exact Excel Valuation Template I used to calculate these numbers.
05 — Valuation
Key Assumptions
| Country | United States |
| Business Risk | Low |
| Discount Rate | 12.36% |
| Revenue Growth — Base | 8.0% |
| Revenue Growth — Bull | 10.0% |
| Revenue Growth — Bear | 3.0% |
| FCF Margin (2032E) | 32.0% |
| Exit P/E Multiple (Base) | 20.0x |
Scenario Analysis
| CASE | PROB. | REV. GROWTH | EXIT P/E | INTRINSIC VALUE |
| Base Case | 60% | 8.0% | 20.0x | $263.49 |
| Bull Case | 20% | 10.0% | 22.0x | $327.62 |
| Bear Case | 20% | 3.0% | 16.0x | $137.99 |
Probability-Weighted Fair Value
| FAIR VALUE $251.22 |
NET CASH / SHARE $-1.29 |
MARGIN OF SAFETY 37.3% |
EXPECTED ANN. RETURN 22.4% |
What This Means
With a current price of $157.41 well below the calculated Fair Value of $251.22 and even the conservative Bear Case scenario of $137.99 providing strong downside protection against the Base Case of $263.49, the stock offers a compelling entry point with a 37.3% Margin of Safety.
Sensitivity Analysis
Base-case Discount Rate and Exit P/E ± one step, holding all else constant. Center cell (highlighted) matches the Base Case assumptions above — this is a single-scenario DCF sensitivity, not the same as the probability-weighted Fair Value shown above.
Intrinsic Value ($ / share)
| DISC. RATE ↓ / EXIT P/E → | 16x | 20x | 24x |
| 11.4% | 222.41 | 278.01 | 333.61 |
| 12.4% | 210.79 | 263.49 | 316.19 |
| 13.4% | 199.88 | 249.85 | 299.82 |
06 — My Take
Overall Conclusion
Booking Holdings is an exceptional business, reflected in its Quality Score of 90.2/100, driven by industry-leading return on invested capital and stellar operating margins. The valuation metrics trigger a clear Good Buy signal, given the 37.3% Margin of Safety and a compressed Forward P/E of 12.7x alongside an 8.1% FCF yield. The primary threat to this thesis is macro travel slowdowns combined with potential pressure from Google’s search distribution dominance. However, given the strong capital returns, dominant global platform, and attractive valuation discount, Booking Holdings presents an exceptionally favorable risk-reward profile for long-term value investors.
Investment Thesis Check
☑ Is it cheap? (Margin of safety at current price)
☑ Is it a good business? (Quality Score reflects durable fundamentals)
☐ Who is running it? (Management track record checked)
☐ What did I miss? (Deliberately looked for the counter-argument)
3 Sources of Returns
☑ Revenue / Earnings Growth
☑ P/E Expansion
☑ Buybacks and Dividends
| VERDICT GOOD BUY |
Technical Analysis
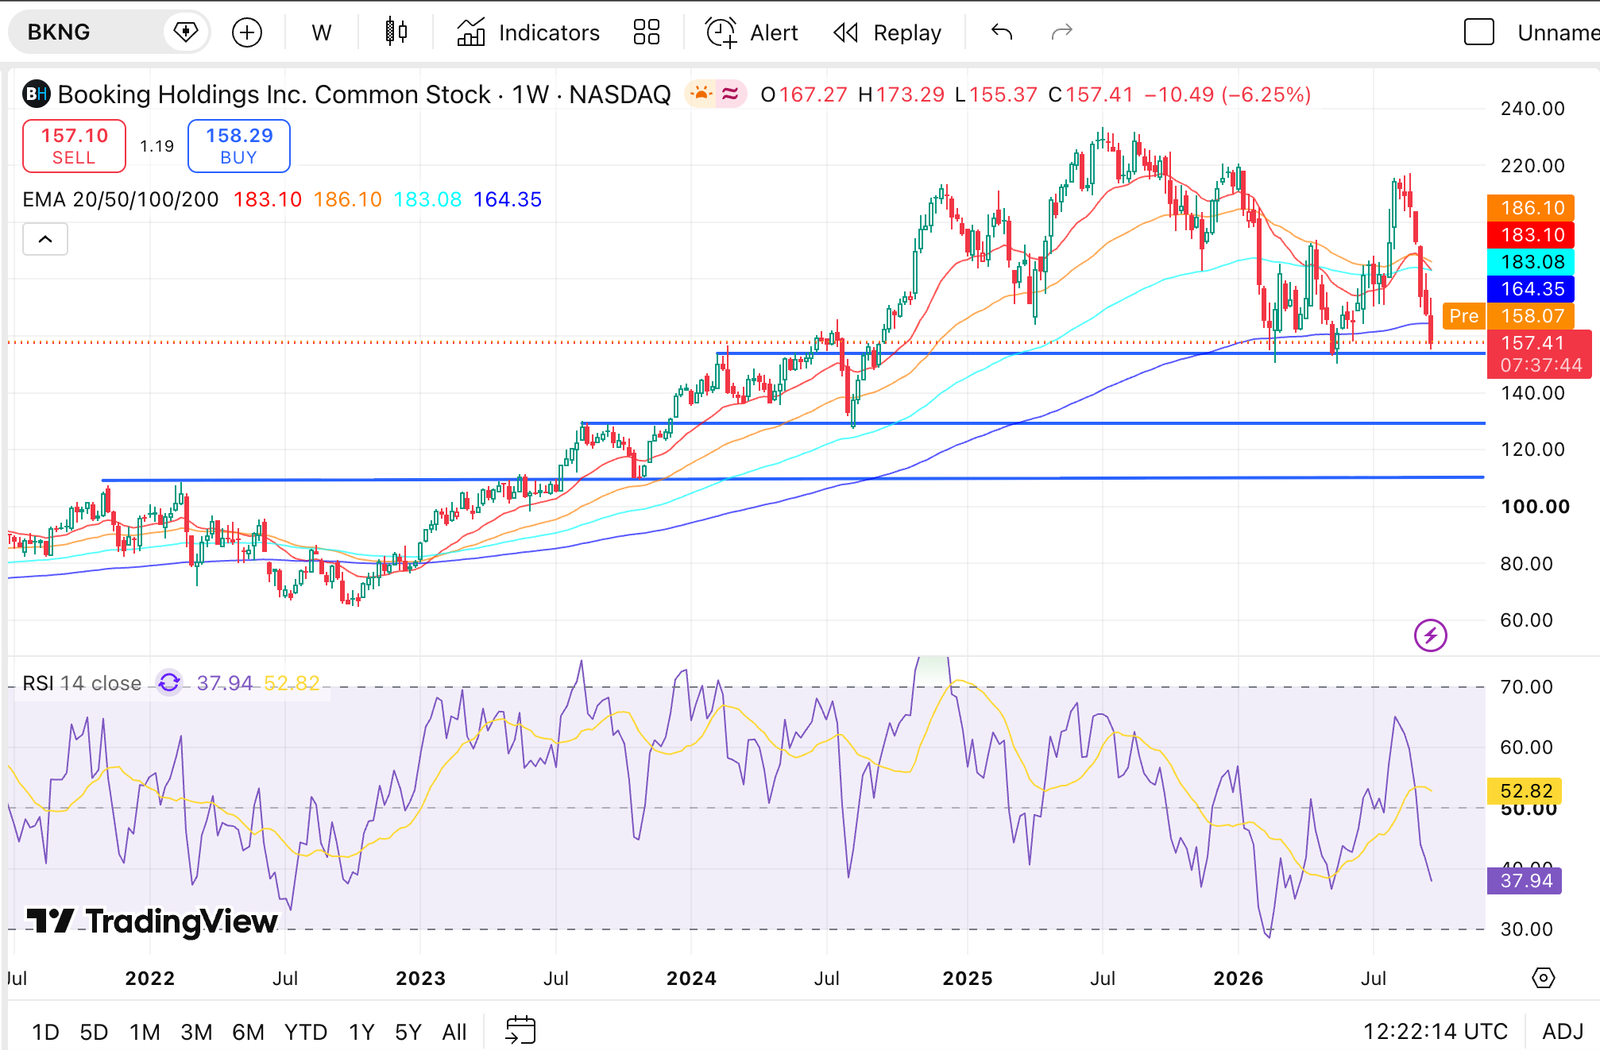
For BKNG stock the next good support levels are 150$, 130$ and 110$.
Where I’m Buying/ Personal Take
Booking is a long position on MoneyJourney portfólio. We still believe in the business to deliver long-term value for the shareholders. As long as our thesis remains intact, we like the company at this valuation.
At the moment BKNG stock is around 5% of our portfolio, and analysing the risk/reward situation here, this is a position where we can increase up to 6% of our portfolio at 150$ level. If the stock continues to go down, our strategy is to increase our position to 8% at 130$ level, and possibly 10% position at 110$ level if we get that incredible opportunity. Of course, as long as the business fundamentals continue strong.